 Original Scientific Paper
UDC: 005.342:338.48(4-12)
DOI: 10.5937/menhottur2600007A
Tourism dynamics in South-East Europe: Similarities and predictability
Cvetko Andreeski1, Biljana Petrevska2*, Iva Nikoloska3
1 St. Kliment Ohridski University, Faculty of Tourism and Hospitality, Ohrid, North Macedonia
2 Goce Delcev University, Faculty of Tourism and Business Logistics, Stip, North Macedonia
3 Municipality of Ohrid, North Macedonia
Abstract
Purpose – This study investigates the dynamics and common tourism patterns of selected countries in South-East Europe in the post-COVID-19 period. The main goal is to classify the countries by inter-country similarities and differences in tourist flows while assessing predictability in tourism demand across the region. Methodology – The research analyzes monthly tourist arrivals for the period 2022–2025 in Albania, Bosnia and Herzegovina, Bulgaria, Croatia, Greece, Montenegro, North Macedonia, Serbia, and Slovenia. It employs K-means and Density-Based Spatial Clustering of Applications with Noise (DBSCAN) clustering to identify time series patterns, while a Seasonal AutoRegressive Integrated Moving Average (SARIMA) panel data model provides a one-year forecast to 2026. Findings – Results reveal three groups: Cluster 0 (Albania, Bulgaria, Croatia, North Macedonia, Slovenia) with similar patterns; Cluster 1 (Bosnia and Herzegovina, Greece, Montenegro); and Serbia as an outlier. Seasonality is lowest in Serbia and highest in Albania and Bulgaria. Forecasts predict the largest growth in Albania (21%), moderate gains in Bosnia and Herzegovina, Bulgaria and Montenegro (6-8%), modest increases in Serbia and Greece (2-3%), slow growth for Croatia (1%) and stagnation for North Macedonia. Implications – This research advances the literature on regional tourism forecasting and supports policymakers in targeting low-seasonality destinations for stable planning and high-growth areas for capacity expansion, enhancing tourism resilience of South-East Europe.
Keywords: tourism dynamics, regional planning, seasonality index, SARIMA forecasting
JEL classification: Z32, C53, R11
Turistička dinamika u jugoistočnoj Evropi: Sličnosti i predvidivost
Sažetak
Svrha – Ova studija istražuje dinamiku i zajedničke obrasce turizma odabranih zemalja u jugoistočnoj Evropi u periodu nakon pandemije COVID-19. Glavni cilj je klasifikacija zemalja prema međusobnim sličnostima i razlikama u protoku turista, uz procenu predvidivosti potražnje za turizmom u regionu. Metodologija – Istraživanje analizira mesečne dolaske turista za period 2022–2025. godina u Albaniji, Bosni i Hercegovini, Bugarskoj, Hrvatskoj, Grčkoj, Crnoj Gori, Severnoj Makedoniji, Srbiji i Sloveniji. Rad koristi K-means i Density-Based Spatial Clustering of Applications with Noise (DBSCAN) klasterizaciju za identifikaciju obrazaca vremenskih serija, dok Seasonal AutoRegressive Integrated Moving Average (SARIMA) panel model omogućava prognozu za 2026 godinu. Rezultati – Rezultati otkrivaju tri grupe: Klaster 0 (Albanija, Bugarska, Hrvatska, Severna Makedonija, Slovenija) sa sličnim obrascima; Klaster 1 (Bosna i Hercegovina, Grčka, Crna Gora); i Srbija kao odstupanje. Sezonalnost je najniža u Srbiji, a najviša u Albaniji i Bugarskoj. Prognoze predviđaju najveći rast u Albaniji (21%), umeren rast u Bosni i Hercegovini, Bugarskoj i Crnoj Gori (6-8%), minimalni rast u Srbiji i Grčkoj (2-3%), spor rast u Hrvatskoj (1%), te stagnaciju u Severnoj Makedoniji. Implikacije – Ovo istraživanje daje doprinos literaturi o regionalnom prognoziranju turizma i pruža podršku donosiocima odluka. Konkretno, usmerava ih ka destinacijama sa niskom sezonalnošću radi stabilnog planiranja i ka oblastima visokog rasta radi proširenja kapaciteta, čime se jača otpornost turizma u jugoistočnoj Evropi.
Klјučne reči: dinamika turizma, regionalno planiranje, indeks sezonalnosti, SARIMA prognoziranje
JEL klasifikacija: Z32, C53, R11
1. Introduction
The global tourism landscape has experienced a marked transformation following the disruptions of the COVID-19 pandemic. Notably, even before the World Health Organization officially declared the end of the public health emergency on May 5, 2023, some destinations had already reported tourist arrivals and overnights surpassing 2019 levels. Yet, behind the numbers, there was a behavioral shift that created a ‘new normal’ for travelers and tourists (Zenker & Kock, 2020).
While Europe has remained the dominant player in global tourism for decades, even in the post-pandemic era, recovery in South-East Europe was “fragmented” and tied to the geographic advantages and income levels of individual countries (Malaj et al., 2025). This recovery has been defined by significant regional heterogeneity (Gajić et al., 2023), resulting in variations in the sustainability of travel and tourism across national borders (Lazarević et al., 2024; Lazarević & Stanišić, 2023). Generally, South-East Europe was framed within the broader European recovery trend, specifically regarding the move toward more sustainable, less volatile tourism models (Gössling et al., 2020). Such a transition was a necessity rather than a simple “return to business as usual” (Nientied & Shutina, 2020), as the region’s overall sustainability depended heavily on its capacity to adapt to external shocks. The post-pandemic era required destinations to move beyond mass-market models toward personalized tourist supply, generally based on digital and sustainable practices (Bešić et al., 2024). This required destinations to evolve from simple locations into complex systems (Jovićić, 2019), as the tourism industry was approaching a long-term structural change requiring sophisticated tools to address post-crisis data volatility (Škare et al., 2021).
South-East Europe represents a complex area with significant, often underutilized tourism potential. The countries share geography, historical ties (Orthodox Christianity dominant in Bulgaria, Greece, Serbia, Montenegro, North Macedonia), Catholicism (Croatia and Slovenia), and Islam (Albania and Bosnia and Herzegovina); many formed former Yugoslavia (Bosnia and Herzegovina, Croatia, Montenegro, North Macedonia, Serbia, and Slovenia). They also have common cultural patterns in similar cuisines (e.g., grilled meats, burek), folk music/dances and maintain regional economic and political links.
On the other hand, the selected South-East European countries differ significantly in tourism development. Some have sea-access and high tourism volumes (Bulgaria, Croatia, and Greece); others are landlocked and rely on inland attractions (North Macedonia, Serbia), or possess a short coastline (Bosnia and Herzegovina) and still-modest tourism contribution to the national economy. This divergence, intensified by varied recovery speeds in the post-pandemic period, prompts a critical inquiry into specific regional developmental patterns.
Rather than assessing which country possesses the greatest capacity to accommodate tourists, this analysis focuses on identifying similarities and divergences in the distribution of tourist flows across the region. Assuming a given volume of arrivals to South-East Europe, this study explores how these visitors are allocated among individual countries. Furthermore, while all examined countries exhibit seasonality, notable variations in the degree and patterns of these fluctuations are observed. This necessitates a deeper investigation into the regional allocation of demand, which adds novelty to this research. Although Zenker and Kock (2020) highlighted the need for new research agendas post-COVID, this study applies those concepts to the selected countries of South-East Europe by identifying the specific clusters that emerged from the crisis. While previous studies have generally investigated tourism dynamics in Western Balkan countries (Bučar, 2017; Knežević et al., 2024; Lazarević et al., 2024; Lazarević & Stanišić, 2023; Nientied & Shutina, 2020; Selimi et al., 2017), this study adopts a broader regional context and investigates nine sampled countries: Albania, Bosnia and Herzegovina, Bulgaria, Croatia, Greece, Montenegro, North Macedonia, Serbia, and Slovenia. Specifically, it addresses two central research questions (RQs):
RQ1: What are the similarities and differences in tourism dynamics?
RQ2: Are there shared patterns in predicting tourism demand?
The paper is structured into five sections. Following this introduction, a literature review contextualizes South-East Europe tourism sector, followed by background material providing stylized facts on post-pandemic recovery. The methodology section details the applied methods for clustering and predictive modeling. The section on results and discussion presents empirical findings, visualizations, and forecasted values. Finally, the paper concludes with a synthesis of the findings.
2. Background material: Contextualizing the tourism sector of South-East Europe
In the academic literature, most studies treat Balkan countries as isolated cases or focus exclusively on Western Balkan countries when analyzing post-pandemic recovery. Nientied and Shutina (2020) discuss the necessity of transforming the Western Balkans to meet the new normality after the pandemic. Due to the region’s heterogeneity, the authors emphasize the need to develop policies and practices for sustainable tourism and to build up the Western Balkans as an integrated destination.
In the same context, Malaj et al. (2025) identify income levels, geographic proximity, and the pandemic as primary determinants of tourism demand for Western Balkan countries. This supports the notion that recovery is tied to specific geographic advantages and digital readiness. Countries with robust domestic and regional markets adapt more smoothly to the challenging new environment, where travelers prioritize nature-based destinations and shorter-haul regional trips.
Recent scholarship also emphasizes that post-pandemic competitiveness is no longer driven solely by traditional geographical assets, but by the ability to offer sustainable and digitally integrated experiences (Bešić et al., 2024). This is particularly reflected in the shift toward “personalized” tourism – a strategy that may help explain why emerging markets (e.g., Albania) exhibit stronger growth dynamics, while more established destinations (e.g., Croatia) face characteristics associated with market maturity. This is further reflected in the varying levels of sustainability and resilience across national borders. Lazarević et al. (2024) illustrate how global crises impact Southern and Mediterranean Europe differently. Their findings suggest that demand pressure and socioeconomic resilience in countries like Serbia and North Macedonia are intrinsically linked to their sustainability profiles. Ultimately, the use of sophisticated analytical tools is necessary to handle post-crisis data volatility as the tourism sector in South-East Europe navigates the balance between rapid growth and long-term structural viability.
In addition to the general academic discussion contextualizing the tourism sector of South-East Europe, a significant theoretical gap remains, particularly regarding comparative research on how these countries compete for the same regional pool of tourists. This research aims to fill that gap by investigating nine countries: Albania, Bosnia and Herzegovina, Bulgaria, Croatia, Greece, Montenegro, North Macedonia, Serbia, and Slovenia.
Table 1: Tourist flows compared to 2019 level
|
Year |
Country |
Arrivals |
Overnights |
||
|
Index |
Recovery year |
Index |
Recovery year |
||
|
2022 |
Albania |
1.074840 |
2022 |
1.177631 |
2022 |
|
2023 |
1.414897 |
1.846627 |
|||
|
2024 |
1.627841 |
2.288581 |
|||
|
2023 |
Bosnia and Herzegovina |
1.069363 |
2023 |
0.993134 |
2024 |
|
2024 |
1.179469 |
1.098833 |
|||
|
2023 |
Bulgaria |
1.006006 |
2023 |
0.890361 |
Not yet |
|
2024 |
1.055552 |
0.926902 |
|||
|
2021 |
Croatia |
1.036217 |
2021 |
0.769379 |
2023 |
|
2022 |
1.092728 |
0.986794 |
|||
|
2023 |
1.14332 |
1.012395 |
|||
|
2024 |
1.228861 |
1.026719 |
|||
|
2022 |
Greece |
1.140668 |
2022 |
1.192504 |
2022 |
|
2023 |
1.299315 |
1.322439 |
|||
|
2024 |
1.349093 |
1.373957 |
|||
|
2023 |
Montenegro |
1.110541 |
2023 |
1.085633 |
2023 |
|
2024 |
1.121255 |
1.103228 |
|||
|
2024 |
North Macedonia |
1.063683 |
2024 |
1.01083 |
2024 |
|
2022 |
Serbia |
1.048578 |
2022 |
1.215651 |
2022 |
|
2023 |
1.136265 |
1.23504 |
|||
|
2024 |
1.201293 |
1.257001 |
|||
|
2023 |
Slovenia |
0.994098 |
2024 |
1.022167 |
2023 |
|
2024 |
1.056778 |
1.068318 |
|||
Source: Authors’ calculations based on: Agency of Statistics of Bosnia and Herzegovina. (n.d.), Croatian Bureau of Statistics. (n.d.), Hellenic Statistical Authority. (n.d.), Institute of Statistics of Albania. (n.d.), National Statistical Institute of Republic of Bulgaria. (n.d.), State Statistical Office of the Republic of North Macedonia. (n.d.), Statistical Office of Montenegro. (n.d.), Statistical Office of the Republic of Serbia. (n.d.), Statistical Office of the Republic of Slovenia. (n.d.)
Before addressing the RQs, it is necessary to identify when each sampled country returned to pre-COVID-19 levels of tourism development. Table 1 presents calculated growth indices for arrivals and overnights for the period 2021-2024, revealing that each of the sampled countries followed a distinct recovery timeline. This variation is primarily driven by coastal access and Mediterranean appeal. Coastal destinations generally recovered faster due to high demand for “sun and sea” tourism, while inland destinations often lagged, relying more heavily on domestic visitors.
Based on Table 1, the recovery dynamics for each country is discussed. Albania reached pre-pandemic levels for both arrivals and overnights in 2022. This rapid recovery is attributed to its long Mediterranean coastline, which attracts budget seekers for beach tourism. Along with Greece and Serbia, Albania experienced the fastest overnight growth in the region. By 2024, the number of tourists was 62.78% higher than in 2019, indicating high demand and infrastructure improvements. Despite a slow start in 2020, arrivals in Bosnia and Herzegovina reached pre-2019 levels in 2023 (1.07), while overnights followed in 2024 (1.10). Limited Adriatic access slowed its recovery, being mainly based on regional visitors.
Although it is a coastal destination, Bulgaria only recovered its arrival numbers in 2023 (1.01), but overnight levels remain unmet. For a Mediterranean country, Bulgaria experienced surprisingly slow recovery. Croatia recorded the fastest increase in arrivals among all sampled countries, exceeding 2019 levels in 2021, generally due to its favorable Adriatic coastline. However, overnights did not recover until 2023, suggesting shorter average stays. Like Albania, Greece surpassed pre-2019 arrivals and overnights in 2022 (1.14/1.19). This quick rebound from a low 2020 base was due to high demand for coastal tourism after intense lockdowns, driven by shifts in traveler psychology and safety concerns (Zenker & Kock, 2020).
Montenegro performed better than Bulgaria, but lagged behind Croatia, Albania, and Greece. Both arrivals and overnights exceeded 2019 levels in 2023. The slowest recovery was for North Macedonia, which reached 2019 levels only in 2024 for both arrivals and overnights. It ranks last in the region due to a lack of sea access, a weak international draw, and delayed effects of economic reopening. Arrivals and overnights in Serbia recovered in 2022, matching Albania and Greece. As a top inland destination, Serbia demonstrated a “non-conformist” resilience and an excellent early recovery by leveraging rural and localized demand (Gajić et al., 2023). Finally, Slovenia achieved full recovery of overnights in 2023 and arrivals in 2024. It recorded a modest growth (6.83%) in 2024, indicating a steady rebound.
Ultimately, it is evident that sampled South-East European countries exhibited varying recovery timelines to reach 2019 levels of tourism development. Croatia (arrivals), Albania, Greece, and Serbia emerged as the most resilient destinations and early achievers (2021-2022), demonstrating the strongest upward growth trajectories. Furthermore, Bosnia and Herzegovina (arrivals), Bulgaria (arrivals), and Montenegro constituted the mid-phase recovery group (2023). Finally, Slovenia and North Macedonia were identified as late rebounders (2024). This evidence reveals a fragmented recovery across the South-East region, characterized by sharp contrasts and diverse tourism patterns.
3. Methodology
The research is based on a quantitative approach using data on monthly tourist arrivals and overnights for the period January 2022 to June 2025 from the national statistical offices of the selected South-East European countries.
Figure 1 illustrates the two-stage methodology, incorporating multiple methods:
1) Stage 1. Classifying countries by inter-country similarities and differences in tourism flows, and
2) Stage 2. Assessing predictability in tourism demand across the region (RQ2).
Figure 1: Research framework
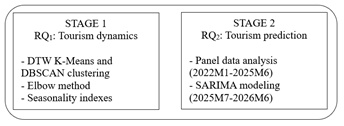
Source: Authors’ research
Stage 1 addresses RQ1 by examining tourism dynamics across the regional destinations by employing three methods:
(1) Dynamic Time Warping (DTW) K-Means and Density-Based Spatial Clustering of Applications with Noise (DBSCAN). The analysis was conducted in Google Colab using the Python programming language. The K-Means algorithm uses Euclidean distances, iteratively minimizing within-cluster sums of squared distances to centroids (cluster means). DBSCAN detects arbitrary-shaped clusters using an ε-distance parameter without pre-specifying the cluster count, though less scalable for large datasets.
(2) The elbow method graphically shows the optimal number of clusters at the point where the within-cluster sum of squares decreases slowly; and
(3) Seasonality indices are computed as monthly values divided by the series mean, with only those months where the index value is greater than 1 being counted. The more months with a value greater than 1, the lower the seasonality.
This integrative approach groups the nine-country time series based on the shape of their evolution over time, not just their raw magnitude. The academic literature discusses classification and modeling of time series in the field of tourism (Agustina et al., 2023; Andreeski & Mechkaroska, 2020; Lascu et al., 2018; Suzuki et al., 2011).
Stage 2 addresses RQ2 by predicting tourism demand and identifying shared patterns among the sampled countries of South-East Europe. This uses panel data analysis (2022M1-2025M6) to identify shared patterns, while tourism demand is forecasted with Seasonal AutoRegressive Integrated Moving Average (SARIMA) modeling (2025M7-2026M6).
4. Results and discussion
Results are presented and discussed in a twofold manner to better address the research questions.
4.1. Regional tourism dynamics
Table 2 presents the results of time series classification using min-max scaling normalization to ensure all features contribute equally to the clustering process. This scaled data helps K-Means to converge faster and more reliably. Additionally, DBSCAN clusters were formed by identifying regions of high density separated by regions of lower density. This was achieved by calculating the ε parameter as the maximum distance between normalized data points, with the minimum cluster size set to 2 countries. Thus, Table 2 presents two clusters numbered as Cluster 0 and Cluster 1, while the countries labeled as -1 are considered outliers. They cannot be classified with other countries based on the input parameters.
Table 2: Results of the K-Means and DBSCAN time series classification
|
Country |
K-Means |
DBSCAN |
|
Albania |
0 |
0 |
|
Bosnia and Herzegovina |
1 |
-1 |
|
Bulgaria |
0 |
0 |
|
Croatia |
0 |
-1 |
|
Greece |
1 |
1 |
|
Montenegro |
1 |
1 |
|
North Macedonia |
0 |
0 |
|
Serbia |
2 |
-1 |
|
Slovenia |
0 |
0 |
Source: Authors’ research
Furthermore, Figure 2 visually presents the results of the elbow method used to determine the optimal number of clusters. A noticeable decline in inertia, i.e., the sum of squared distances from each data point to its closest cluster center, is observed. The rate of error decay significantly slows after number three, identifying this as the optimal number for the analysis (Agustina et al., 2023; Suzuki et al., 2011).
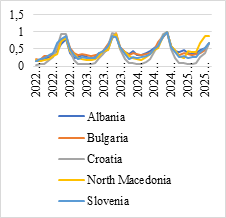
According to Figure 3, the countries are grouped into the following three clusters:
· Cluster 0: Albania, Bulgaria, Croatia, North Macedonia, and Slovenia.
· Cluster 1: Bosnia and Herzegovina, Greece, and Montenegro, and
- Cluster 2: Serbia.
Figure 2: Elbow method for optimal number of clusters
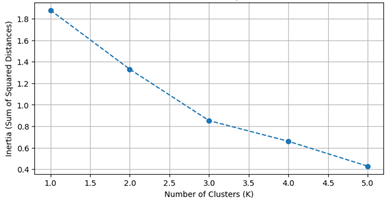
Source: Authors’ research
Based on the clustering results from the DBSCAN algorithm, Cluster 0 (Albania, Bulgaria, North Macedonia, and Slovenia) is the largest and most diverse group. The analysis also reveals that Croatia exhibits a marked deviation from the series values associated with these four countries, thereby distinguishing its trajectory from the rest of the cluster. It is notable that this cluster groups an early achiever such as Albania with a late rebounder like North Macedonia. This suggests that while their recovery speeds varied, the “shape” of their recovery curves – marked by a sharp 2020 drop followed by a consistent, multi-year upward trajectory – is mathematically analogous. More precisely, when the data are normalized through min-max scaling, the underlying pattern of growth across these five countries is statistically similar, even if their total volume or specific recovery years differ. These findings are consistent with previous studies highlighting fragmented and heterogeneous recovery patterns (Gajić et al., 2023; Malaj et al., 2025), confirming that post-pandemic tourism dynamics are shaped by structural and geographical differences.
On the other hand, Bulgaria, North Macedonia, and Slovenia did not experience immediate growth. Instead, they exhibited steady, stabilizing patterns, leading to their identification as a single coherent unit. Figure 3 presents the normalized values of their time series, with Croatia showing the largest deviation. While other countries showed a more gradual climb, Croatia's normalized curve lay consistently higher in the early stages of the time series.
|
Figure 3: Normalized time series – Cluster 0 |
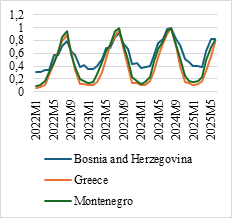
Figure 4: Normalized time series – Cluster 1 |
|
|
|
Source: Authors’ research
Figure 4 illustrates the normalized time series for the countries in Cluster 1: Greece, Montenegro, and Bosnia and Herzegovina (as an outlier). There is a significant visual overlap between the trajectories of Greece and Montenegro, with a slight deviation observed in Bosnia and Herzegovina. Nevertheless, K-Means analysis indicates that the mathematical distances between these three series are the smallest, leading to their grouping in a joint cluster. While Greece and Montenegro shared a “sun and sea” recovery, the inclusion of Bosnia and Herzegovina suggests that despite its slower start in 2020, its normalized growth trajectory eventually mirrored the recovery shape of Montenegro.
Serbia is placed in Cluster 2, representing a unique recovery pattern that does not fit within the high-density region of other groups, with an exceptional recovery performance, comparable to top coastal destinations (rebounding fully by 2022) despite being an inland destination.
To understand the implications of the identified differences, seasonality indices were calculated. This enabled the identification of countries with lower seasonality and allowed for ranking them from the least seasonal to the most seasonal destinations.
Table 3 presents calculated seasonality indices based on the number of months with values greater than 1. In this context, a higher value is preferable, as it represents lower seasonality. Serbia has the highest value (22), identifying it as the country with the lowest seasonality with tourism demand more evenly distributed across months and exhibiting narrower fluctuations between its minimum and maximum values. The lower standard deviation in monthly figures reinforces Serbia’s position as a more resilient destination against seasonal shocks. Unlike other coastal destinations in South-East Europe, its tourism development is not threatened by a single season, allowing for a stable distribution of demand and high growth. These findings align with the observations of Škare et al. (2021) regarding the stabilization of regional demand over international long-haul volatility.
Table 3: Seasonality indices
|
Country |
Index |
|
Serbia |
22 |
|
Montenegro |
21 |
|
Bosnia and Herzegovina |
19 |
|
North Macedonia |
19 |
|
Greece |
18 |
|
Slovenia |
17 |
|
Croatia |
16 |
|
Albania |
15 |
|
Bulgaria |
13 |
Source: Authors’ research
Interestingly, the second-ranked country is Montenegro (21), which exhibits lower seasonality than other coastal destinations, such as Greece (18) or Croatia (16). This suggests that Montenegro has diversified its tourism supply beyond high summer peaks. Yet, despite concentrated demand and their pronounced seasonal character, Greece and Croatia recovered quickly. This is particularly noticeable in the shorter-stays trend in Croatia, where arrivals recovered faster than overnights. Next are Bosnia and Herzegovina and North Macedonia (19), along with Slovenia (17). The same finding of low seasonality, which offers no substantial benefit to tourism development in North Macedonia, was previously evidenced by Petrevska (2013) and Trajkov et al. (2016), who argued that the country produces permanently modest tourism results. The most pronounced seasonal character is found in the tourist arrivals for Albania (15) and Bulgaria (13). Bulgaria is the most seasonal destination among the sampled countries. It has highly concentrated tourism demand in the summer season, resulting in a more polarized distribution, indicating its vulnerability to off-season volatility.
4.2. Shared patterns and predictive tourism modeling
To predict tourism demand, the data were organized into a single panel. Due to their distinct seasonal character, an upward trend, and heteroscedasticity within the series, prior to modeling, a cross-sectional dependence test was performed to determine their stationarity (Table 4). The series were first logarithmized, followed by second-order differencing.
Table 4: Cross sectional dependence: Pesaran – CIPS test
|
Cross unit root test |
Cross-sectional ADF unit root test |
|||||||
|
Null hypothesis: Unit root |
Null hypothesis: Unit root for specidied cross-section |
|||||||
|
Test results: |
Lag selection: AIC with maxlag=6 |
|||||||
|
Statistic |
t-stat |
p-value |
Test results |
CADF |
Truncated |
CADF |
||
|
CPS: |
-5.63595 |
<0.01 |
Cross-section |
ADF lags |
t-stat |
p-value |
t-stat |
p-value |
|
Truncated CIPS: |
-5.11380 |
<0.01 |
1 |
4 |
-6.1552 |
<0.01 |
-6.1552 |
<0.01 |
|
Critical values: |
2 |
6 |
-4.2592 |
<0.01 |
-4.2592 |
<0.01 |
||
|
Level |
CIPS |
Trunc.CIPS |
3 |
3 |
-10.598 |
<0.01 |
-10.598 |
<0.01 |
|
1% |
-2.56 |
-2.56 |
4 |
6 |
-5.9717 |
<0.01 |
-5.9717 |
<0.01 |
|
5% |
-2.33 |
-2.33 |
5 |
5 |
-6.4811 |
<0.01 |
-6.4811 |
<0.01 |
|
10% |
-2.21 |
-2.21 |
6 |
6 |
-3.9011 |
<0.05 |
-3.9011 |
<0.05 |
|
|
7 |
6 |
-5.8241 |
<0.01 |
-5.8241 |
<0.01 |
||
|
8 |
6 |
-4.8483 |
<0.01 |
-4.8483 |
<0.01 |
|||
|
9 |
6 |
-4.2971 |
<0.01 |
-4.2971 |
<0.01 |
|||
|
Critical values: |
||||||||
|
Level |
CADF |
Trunc. CADF |
|
|
||||
|
1% |
-4.03 |
-4.03 |
|
|
|
|||
|
5% |
-3.33 |
-3.33 |
|
|
|
|||
|
10% |
-2.96 |
-2.96 |
|
|
|
|||
Source: Authors’ research
As shown in Table 5, the probability that the series were non-stationary was less than 1%, that is, the series were confirmed to be stationary following these transformations. During the modeling process, the 12th lag in the correlogram was identified as a critical component for defining seasonal patterns. After testing various parameters, such as SAR(12) and AR(1), the final specification was SARIMA(1,2,0)(1,0,0) model. As shown in Table 6, the model parameters indicate a good fit, evidenced by significance levels below 1%, a high R2, and an adjusted R2 exceeding 0.8. Furthermore, the Durbin-Watson statistic was close to 2.0, indicating an absence of serial correlation in the residuals, while the low absolute values of the information criteria further supported the accuracy of the model.
Table 5: Model parameters
|
Cross-sections included: 9 |
||||
|
Total panel (balanced) observations: 243 |
||||
|
Convergence achieved after 6 iterations |
||||
|
Variable |
Coefficient |
Std. Error |
t-Statistic |
Prob. |
|
AR(1) |
-0.579597 |
0.052955 |
-10.94514 |
0.0000 |
|
SAR(12) |
0.887141 |
0.026811 |
33.08822 |
0.0000 |
|
R-squared |
0.802600 |
Mean dependent var |
-0.001418 |
|
|
Adjusted R-squared |
0.801781 |
S.D. dependent var |
0.326575 |
|
|
S.E. of regression |
0.145397 |
Akaike info criterion |
-1.010503 |
|
|
Sum squared resid |
5.094802 |
Schwarz criterion |
-0.981753 |
|
|
Log likelihood |
124.7761 |
Hannan-Quinn criterion |
-0.998923 |
|
|
Durbin-Watson stat |
2.606609 |
|
|
|
Source: Authors’ research
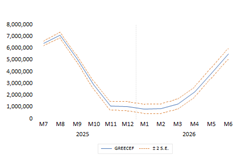
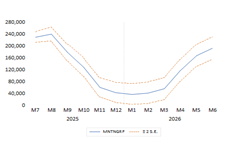
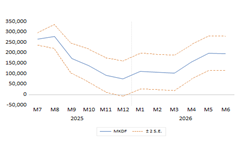
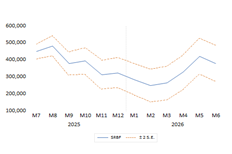
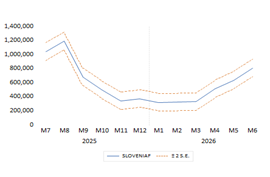
Figure 5: Forecasted data for sampled countries, 2025M7-2026M6
|
|
|
|
7a) Albania |
7b) Bosnia and Herzegovina |
|
|
|
|
7c) Bulgaria |
7d) Croatia |
|
|
|
|
7e) Greece |
7f) Montenegro |
|
|
|
|
7g) North Macedonia |
7h) Serbia |
|
|
|
|
|
|
|
7i) Slovenia |
|
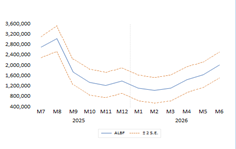
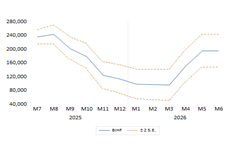
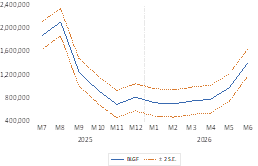
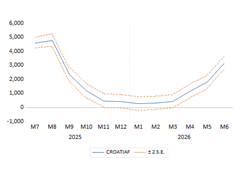
Source: Authors’ research
The final step before forecasting was the residual normality test. This analysis ensured that the residual series followed a normal distribution with no prior internal correlation. This confirmed that the residuals represented a series of white noise, validating the model.
Finally, Figure 5 presents the one-year forecast for each country (blue line), along with tourism demand fluctuations within a confidence interval of ±2 standard errors (red lines). This interval provides policymakers with a realistic range for both best-case and worst-case tourism scenarios.
Table 6 summarizes the forecasted tourism demand values. However, these figures require a cautious interpretation, as they are mean values within a ±2 standard error confidence interval. The index values enable cross-country comparisons, ensuring that the high volume of Greece does not overshadow growth in smaller destinations like Albania. These results provide a basic indicator for future tourism development, assuming constant environmental conditions.
Table 6: Forecasted data for sampled countries
|
Country |
2025 M1-M6 |
2026 M1-M6 Forecast |
Index |
|
Albania |
14,629,026 |
17,714,171 |
1.2109 |
|
Bosnia and Herzegovina |
1,326,933 |
1,404,052 |
1.0581 |
|
Bulgaria |
9,724,222 |
10,483,555 |
1.0781 |
|
Croatia |
16,284,000 |
16,362,414 |
1.0048 |
|
Greece |
27,899,981 |
28,829,283 |
1.0333 |
|
Montenegro |
1,091,807 |
1,177,337 |
1.0783 |
|
North Macedonia |
956,972 |
956,000 |
0.9990 |
|
Serbia |
2,936,434 |
3,003,720 |
1.0229 |
|
Slovenia |
5,064,489 |
5,356,605 |
1.0577 |
Source: Authors’ research
Forecasted values for 2026 (Figure 5 and Table 6) reveal a diversified landscape for tourism development. Albania is projected to achieve the largest increase in tourism demand in terms of tourist arrivals. With an expected growth rate of 21% it is projected to be a leader in the region. This expansion is likely driven by its emerging appeal. While other traditional markets are maturing, Albania offers “personalized” post-pandemic tourism, with sustainable, digitally integrated experiences (Bešić et al., 2024).
Far behind are Montenegro, Bulgaria, and Bosnia and Herzegovina with projected moderate growth between 6% and 8%, representing steady expansion above the regional average. In contrast, Serbia and Greece face more modest increases of 2% to 3% indicating mature markets or post-pandemic stabilization.
With anticipated growth of only 1%, Croatia is entering a 'plateau' phase, common for mature, already famous destinations that cannot grow indefinitely. It approaches 'over-tourism' thresholds or carrying capacity limits where growth shifts from quantity (arrivals) to quality (per-capita spending).
The results for North Macedonia indicate potential structural constraints, as forecasted arrivals remain nearly unchanged compared to 2025 levels. This flat growth (index = 0.9990) indicates 'plateau' effect. While earlier projections predicted steady growth for North Macedonia (Petrevska, 2012; 2017), these new findings reveal a sharp shift to a flatline trajectory. This divergence reflects post-pandemic structural transformations that were not evident in previous decades. This suggests limited growth dynamics, indicating the need for targeted policy adjustments, including the development of new tourism drivers, diversification toward new geographic markets (e.g., Asian tourists), and a shift from mass to high-value tourism.
Overall, these projections indicate that while the region maintains an upward trend, the drivers of growth per country differ significantly, creating stark contrasts in development trajectories. These trajectories range from strong growth patterns in emerging destinations (Albania), to signs of saturation in more mature markets (Greece, Croatia), to relatively stable trends despite continued efforts (North Macedonia). This divergence requires policymakers to adapt to this increasingly fragmented and competitive regional landscape. The observed divergence in growth trajectories supports recent findings that post-pandemic tourism development increasingly depends on adaptability, sustainability, and market positioning (Bešić et al., 2024).
5. Conclusion
This study examines tourism dynamics across the sampled countries in South-East Europe, identifying significant disparities in recovery and growth. Prior to the main analysis, a stylized examination of tourism recovery to pre-2019 levels revealed clear patterns generally tied to geography. Coastal destinations, such as Croatia, Albania, and Greece, recovered fastest (by 2021-2022) due to sea appeal. Conversely, Montenegro, Bosnia and Herzegovina, and Slovenia, despite sea access, reached 2019 levels later, in 2023. Notably, inland Serbia achieved the strongest recovery, fully rebounding by early 2022, while Bulgaria and North Macedonia lagged behind all other sampled countries.
The dual-algorithm approach confirmed regional synchronized patterns alongside fragmented recovery and demand. Clustering analysis grouped countries with statistically similar monthly distributions into three groups: Cluster 0 (Albania, Bulgaria, Croatia, North Macedonia, Slovenia), Cluster 1 (Bosnia and Herzegovina, Greece, Montenegro), and Cluster 2 (Serbia as an outlier). Serbia is a unique case exhibiting highly specific, non-conformist growth curve that matches the recovery speed of coastal destinations (like Greece, Albania) despite lacking sea access.
Furthermore, the analyses confirmed seasonality across all countries. Serbia demonstrated the weakest seasonality, facilitating more stable demand forecasting, while Bulgaria exhibited the most profound seasonal fluctuations.
Finally, this study projected tourism demand through June 2026 using a panel data approach and SARIMA model. Forecasts reveal a highly diversified future, ranging from an increase over 20% for Albania, to the stagnation of North Macedonia at 2025 levels.
From a policy perspective, the findings suggest differentiated strategic approaches across the region. Emerging destinations with strong growth dynamics should prioritize infrastructure expansion and sustainable capacity management to avoid future over-tourism pressures. In contrast, mature destinations should focus on improving quality, diversification, and off-season tourism to mitigate saturation effects. For countries with stable but limited growth, targeted interventions such as market diversification, development of niche tourism products, and digital promotion strategies are essential to stimulate demand and enhance competitiveness.
This research has several limitations. First, the model relies primarily on historical univariate time-series data, which does not account for sudden exogenous shocks such as geopolitical shifts, drastic changes in fuel prices, or similar. Second, data are quantitative and lack the qualitative depth. Lastly, the panel data approach may obscure localized country-specific events that influence short-term demand.
Future research may extend this work with multivariate frameworks (like ARDL or VAR models) incorporating economic indicators as explanatory variables. Also, future work may include high-frequency data (like hotel occupancy rates) or digital footprint data to offer more real-time insights into tourism patterns. Finally, investigating the "plateau" effect in countries like North Macedonia through qualitative policy analysis could provide a better understanding of the structural barriers preventing tourism development.
CRediT author statement
Cvetko Andreeski: Visualization, Software, Validation, Formal analysis, Conceptualization, Supervision. Biljana Petrevska: Writing – review & editing, Writing – original draft, Methodology, Investigation, Conceptualization. Iva Nikoloska: Writing – review, Data collection, Investigation.
Declaration of generative AI in the writing process
During the preparation of this work, the authors utilized Google Colab with the Python programming language to calculate tourism dynamics. For the writing process, the authors used Gemini to review and edit the grammatical content. The authors have reviewed the final output and take full responsibility for the content of the published article.
Acknowledgement
This research is part of the scientific research project “Application of predictive analytics and artificial intelligence for the advancement of tourism in North Macedonia”, funded by the Ministry of Education and Science of the Republic of North Macedonia, under number 15-6171/19 dated August 7, 2025.
Conflict of interest
The authors declare no conflict of interest.
References
1. Agency of Statistics of Bosnia and Herzegovina. (n.d.). Tourism. Retrieved December 20, 2025 from https://bhas.gov.ba/
2. Agustina, C., Purwanto, P., & Farikhin, F. (2023). Comparison of simple matching coefficient and Euclidean distance in K-means algorithm for tourism destination classification. E3S Web of Conferences (Vol. 448, p. 02011). EDP Sciences. https://doi.org/10.1051/e3sconf/202344802011
3. Andreeski, C., & Mechkaroska, D. (2020). Modelling, forecasting and testing decisions for seasonal time series in tourism. Acta Polytechnica Hungarica, 17(10), 149–171. https://doi.org/10.12700/APH.17.10.2020.10.9
4. Bešić, C., Bogetić, S., Bakator, M., & Petrevska, I. (2024). The impact of sustainability, digital technologies, and employee knowledge on the competitiveness of personalized tourist offer. Hotel and Tourism Management, 12(1), 133–152. https://doi.org/10.5937/menhottur2400010B
5. Bučar, K. (2017). Green orientation in tourism of Western Balkan countries. Green economy in the Western Balkans: Towards a sustainable future (pp. 175–209). Emerald Publishing Limited. https://doi.org/10.1108/978-1-78714-499-620171006
6. Croatian Bureau of Statistics. (n.d.). Statistical data. Retrieved December 20, 2025 from https://dzs.gov.hr/
7. Gajić, T., Đoković, F., Blešić, I., Petrović, M. D., Radovanović, M. M., Vukolić, D., ... & Mićović, A. (2023). Pandemic boosts prospects for recovery of rural tourism in Serbia. Land, 12(3), 624. https://doi.org/10.3390/land12030624
8. Gössling, S., Scott, D., & Hall, C. M. (2020). Pandemics, tourism and global change: A rapid assessment of COVID-19. Journal of Sustainable Tourism, 29(1), 1–20. https://doi.org/10.1080/09669582.2020.1758708
9. Hellenic Statistical Authority. (n.d.). Economy indicators. Retrieved December 20, 2025 from https://www.statistics.gr/
10. Institute of Statistics of Albania. (n.d.). Database. Retrieved December 20, 2025 from https://www.instat.gov.al/
11. Jovićić, D. Z. (2019). From the traditional understanding of tourism destination to the smart tourism destination. Current Issues in Tourism, 22(3), 276–282. https://doi.org/10.1080/13683500.2017.1313203
12. Knežević, M., Pindžo, R., Ćulić, M., Kovačić, S., Dunjić, M., & Vujko, A. (2024). Sustainable (re) development of tourism destinations as a pledge for the future – A case study from the Western Balkans. Geojournal of Tourism and Geosites, 56(4), 1564–1575. https://doi.org/10.30892/gtg.56413-1327
13. Lascu, D. N, Manrai, L. A., Manrai, A. K., & Gan, A. (2018). A cluster analysis of tourist attractions in Spain: Natural and cultural traits and implications for global tourism. European Journal of Management and Business Economics, 27(3), 218–230. https://doi.org/10.1108/EJMBE-08-2017-0008
14. Lazarević, S., & Stanišić, T. (2023). The impact of global crises on international tourism in the Southern and Mediterranean Europe. Hotel and Tourism Management, 11(2), 103–115. https://doi.org/10.5937/menhottur2302103L
15. Lazarević, S., Stanišić, T., & Leković, M. (2024). Travel and tourism sustainability in the Balkan countries. Tourism International Scientific Conference Vrnjačka Banja-TISC, Vol. 8, No. 1 (pp. 439–447). https://doi.org/10.52370/TISC24439SL
16. Malaj, E., Malaj, V., & Firza, N. (2025). Determinants of tourism demand for Western Balkans countries: A system generalized method of moments (GMM) approach. Sapienza: International Journal of Interdisciplinary Studies, 6(1), e25009–e25009. https://doi.org/10.51798/sijis.v6i1.917
17. National Statistical Institute of Republic of Bulgaria. (n.d.). Statistical Data. Retrieved December 20, 2025 from https://www.nsi.bg/
18. Nientied, P., & Shutina, D. (2020). Tourism in transition, the post-Covid-19 aftermath in the Western Balkans. Journal of Western Balkan Network on Territorial Governance, 46-60. https://doi.org/10.32034/CP-PPRESI-P01-02
21. Petrevska, B. (2017). Predicting tourism demand by A.R.I.M.A. models. Economic Research, 30(1), 939–950. https://doi.org/10.1080/1331677X.2017.1314822
22. Selimi, N., Sadiku, L., & Sadiku, M. (2017). The impact of tourism on economic growth in the Western Balkan countries: An empirical analysis. International Journal of Business and Economic Sciences Applied Research (IJBESAR), 10(2), 19–25. https://doi.org/10.25103/ijbesar.102.02
23. Škare, M., Soriano, D. R., & Porada-Rochoń, M. (2021). Impact of COVID-19 on the travel and tourism industry. Technological Forecasting and Social Change, 163, 120469. https://doi.org/10.1016/j.techfore.2020.120469
24. State Statistical Office of the Republic of North Macedonia. (n.d.). Makstat data base. Retrieved December 20, 2025 from https://www.stat.gov.mk/
25. Statistical Office of Montenegro. (n.d.). Statistics Tourism. Retrieved December 20, 2025 from https://monstat.org/cg/
26. Statistical Office of the Republic of Serbia. (n.d.). Database. Retrieved December 20, 2025 from https://stat.gov.rs/
27. Statistical Office of the Republic of Slovenia. (n.d.). Sistat database. Retrieved December 20, 2025 from https://www.stat.si/statweb
28. Suzuki, S., Nijkamp, P., & Rietveld, P. (2011). Regional efficiency improvement by means of data envelopment analysis through Euclidean distance minimization including fixed input factors: An application to tourist regions in Italy. Papers in Regional Science, 90(1), 67–90. https://doi.org/10.1111/j.1435-5957.2010.00316.x
29. Trajkov, A., Biljan, J., & Andreeski, C. (2016). Overview and characteristics of tourism seasonality in Ohrid. Economic Themes, 54(4), 485–498. https://doi.org/10.1515/ethemes-2016-0024
30. Zenker, S., & Kock, F. (2020). The coronavirus pandemic – A critical discussion of a tourism research agenda. Tourism Management, 81, 104164. https://doi.org/10.1016/j.tourman.2020.104164