 Original Scientific Paper
UDC: 338.487:346.548
005.334:338.48
DOI: 10.5937/menhottur2500009L
Risk and safety in tourism: How trust in information sources shapes travel risk tolerance across national contexts?
Boriša Lečić1, Yerlan Issakov2, Lóránt Dénes Dávid3,4, Tamara Gajić5,6*
1 Union University Belgrade, Faculty of Law and Business Studies Dr Lazar Vrkatić, Novi Sad, Serbia
2 Abai Kazakh National Pedagogical University, Faculty of Natural Sciences and Geography, Department of Geography and Ecology, Almaty, Kazakhstan
3 John von Neumann University, Faculty of Economics and Business, Department of Tourism and Hospitality, Kecskemét, Hungary
4 Eötvös Loránd University, Faculty of Social Sciences, Savaria University Centre, Savaria Department of Business Economics, Szombathely, Hungary
5 Serbian Academy of Sciences and Arts, Geographical Institute “Jovan Cvijić”, Belgrade, Serbia
6 Swiss School of Business and Management, Geneva, Switzerland
Abstract
Purpose – This study investigates how perceived risk dimensions (physical, financial, psychological, social, and temporal) and trust in traditional media, social media, and official sources influence travel risk tolerance among domestic tourists in Serbia, Hungary, and Kazakhstan. It explores cross-national differences and the role of institutional and informational factors in tourist behavior under uncertainty. Methodology – A quantitative approach was applied with 1,332 respondents, using validated instruments and structural equation modeling (PLS-SEM). Exploratory and confirmatory factor analyses ensured construct validity, while multigroup analysis (MGA) assessed structural differences across countries. Findings – General risk tolerance and trust in social media are key predictors in Serbia and Kazakhstan, whereas trust in traditional media and government sources dominates in Hungary. Psychological and physical risks notably affect tourists in Hungary and Kazakhstan, but less so in Serbia, reflecting cultural and institutional variations in risk management. Implications – The study extends tourism risk perception models by integrating trust dimensions and highlights the need for culturally tailored crisis communication. It offers practical guidance for destination managers and policymakers to design effective, source-specific communication strategies that align with national patterns of trust and resilience.
Keywords: risk tolerance, risk perception, tourist safety, media trust, tourist behavior
JEL classification: Z32, D81
Rizik i bezbednost u turizmu: Kako poverenje u izvore informacija oblikuje toleranciju na rizik u putovanjima kroz različite nacionalne kontekste?
Sažetak
Svrha – Ova studija ispituje kako dimenzije percipiranog rizika (fizički, finansijski, psihološki, socijalni i vremenski) i poverenje u tradicionalne medije, društvene mreže i zvanične izvore utiču na toleranciju rizika pri putovanju među domaćim turistima u Srbiji, Mađarskoj i Kazahstanu. Analiziraju se međudržavne razlike i uloga institucionalnih i informacionih faktora u ponašanju turista u uslovima neizvesnosti. Metodologija – Primenjen je kvantitativni pristup na uzorku od 1.332 ispitanika, korišćenjem validiranih instrumenata i modelovanja strukturnih jednačina (PLS-SEM). Validnost konstrukata potvrđena je eksploratornim i konfirmatornim faktorskim analizama, a multigrupna analiza (MGA) korišćena je za ispitivanje razlika između zemalja. Rezultati – Opšta tolerancija rizika i poverenje u društvene mreže ključni su prediktori u Srbiji i Kazahstanu, dok u Mađarskoj dominira poverenje u tradicionalne medije i državne izvore. Psihološki i fizički rizici značajno utiču na ponašanje turista u Mađarskoj i Kazahstanu, ali manje u Srbiji, što odražava kulturološke i institucionalne razlike. Implikacije – Studija unapređuje modele percepcije rizika u turizmu integracijom dimenzija poverenja u izvore informacija i ukazuje na potrebu za kulturno prilagođenom kriznom komunikacijom. Nalazi nude praktične smernice za menadžere destinacija i kreatore politika u oblikovanju efikasnih strategija komunikacije.
Ključne reči: tolerancija na rizik, percepcija rizika, bezbednost turista, poverenje u medije, turističko ponašanje
JEL klasifikacija: Z32, D81
1. Introduction
Contemporary tourist behavior is increasingly shaped by global uncertainty, with risk perception emerging as a key factor influencing travel decisions (Matiza & Kruger, 2021; Vasilić & Savić, 2025). Although risk affects all stages of travel planning (Pinto et al., 2025), its perception remains subjective, varying across cultural, institutional, and informational contexts (Hsiao et al., 2025). Existing studies often remain limited to national contexts or isolated aspects of risk, without systematically comparing how different types of perceived risk and trust in information sources jointly influence travel behavior across diverse settings. For instance, in Serbia, dominant concerns involve health-related risks and distrust in institutions (Perić et al., 2021), in Hungary the focus lies on tourism protocols and communication systems (Tokodi, 2022), while Kazakhstan faces challenges related to geo-ecological stability and destination safety (Chlachula et al., 2021). Additionally, the role of general risk orientation in shaping specific travel decisions remains insufficiently explored (Li et al., 2024; Rajnović et al., 2025). The aim of this study is to develop and empirically test an integrated model that explains how various dimensions of perceived risk (physical, financial, psychological, social, and temporal) and trust in different information sources (government, traditional media, social media) influence travel risk tolerance. By applying a comparative analysis across Serbia, Hungary, and Kazakhstan, the study addresses key theoretical gaps and offers new insights into culturally embedded patterns of risk perception and decision-making under uncertainty. This research advances existing knowledge by systematically incorporating information trust and risk orientation into a unified framework, contributing to both theory and practical understanding of tourist behavior in crisis contexts.
2. Background and related work
In the contemporary context of frequent crises and global uncertainty, safety and risk have become dominant forces shaping tourist behavior (Zou & Meng, 2020). While it is well established that perceived risk and individual tolerance influence travel decisions (Li et al., 2024), recent studies emphasize the predominance of emotional and social responses over purely rational assessments (Kim et al., 2021). Rahmafitria et al. (2021) and Stevanović and Gajić (2024) argue that pandemic-related experiences have significantly altered long-term travel patterns, increasing the salience of personal risk tolerance, now more deeply rooted in values and past exposures (Chernyshev et al., 2023; Ting et al., 2020). Among risk categories, physical risk is consistently cited as a deterrent to travel (Godovykh et al., 2021), though its actual effect is mediated by habituation, cultural norms, and local infrastructure (Yang & Wibowo, 2025). Financial risk, encompassing fears of unexpected costs and poor returns, has a negative impact on travel intentions (Khasawneh & Alfandi, 2019), but its intensity varies depending on tourists’ income profiles. Psychological risk, marked by anxiety in unfamiliar contexts, may inhibit or, paradoxically, trigger information-seeking behaviors (Oshriyeh et al., 2022), yet its long-term behavioral impact remains inconclusive. Social risk appears more relevant in collectivist cultures where family and peer approval strongly shape intentions (Seočanac & Veljović, 2025; Tiwari & Omar, 2023), though empirical support across demographics is still limited. Lastly, temporal risk, though often neglected, can significantly reduce the perceived value of travel, particularly in cases of delays or poor infrastructure (Tanina et al., 2022), but its direct influence on risk tolerance is understudied. Based on these theoretical insights and identified empirical gaps, the following hypotheses are proposed:
H1: Higher perception of physical risk negatively affects travel risk tolerance.
H2: Higher perception of financial risk reduces travel risk tolerance.
H3: Psychological risk has a negative impact on travel risk tolerance.
H4: Higher perception of social risk reduces travel risk tolerance.
H5: Temporal risk negatively affects travel risk tolerance.
Some studies have highlighted the importance of traditional media in strengthening the institutional image of destinations (De La Hoz-Correa & Muñoz-Leiva, 2019), but more recent studies highlight a decline in trust due to inaccuracies and the politicization of content (Cheng et al., 2025). This raises the question of how much tourists today actually rely on television, newspapers, and radio when making decisions in crisis situations. Social media platforms have become the dominant source of information despite fluctuating levels of trust, with digital literacy, age, and cultural background significantly shaping perceptions of credibility (Martínez et al., 2020). Authenticity of brands on social networks, as shown by Zhang et al. (2022), can enhance user trust, suggesting that the impact of social media on risk tolerance depends largely on personal attitudes toward the reliability of information. Trust in government sources, while important for supporting tourism (Asaduzzaman et al., 2025; Nunkoo & Gursoy, 2019;), has been shown in more recent studies (Silva Dos Santos et al., 2025) to depend on integration with local and digital communication channels, rather than on institutional authority alone. Based on these insights, the following hypotheses are proposed:
H6: Trust in traditional media positively affects travel risk tolerance.
H7: Trust in social media positively affects travel risk tolerance.
H8: Trust in government sources increases travel risk tolerance.
Particular attention was given to the dimension of general risk orientation, which reflects an individual’s willingness to accept uncertainty and potential negative outcomes across different areas of life. Meertens and Lion (2008) developed a reliable instrument for measuring this trait and demonstrated its stable association with behavior, including travel decision-making. However, findings indicate that a high level of general risk tolerance does not necessarily translate into a willingness to travel to all types of uncertain environments, especially when additional social or health-related risks are present. Based on these insights, the following hypothesis is proposed:
H9: Higher general risk tolerance positively influences travel risk tolerance.
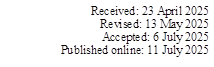
This study applies a comparative approach to examine differences among Serbia, Hungary, and Kazakhstan in tourism development, institutional stability, and trust in information sources. In Serbia, distrust in official channels and reliance on social media prevail (Fuchs, 2024; Vukolić et al., 2022), while Hungary shows stronger trust in traditional media (Kupi & Bakó, 2024). In Kazakhstan, weak institutional credibility is offset by greater dependence on informal sources (Tleuberdinova et al., 2025). Structural model illustrating the direct effects of perceived risk dimensions (PPR, PFR, PsyR, PSR, PTR), trust in information sources (TTM, TSM, TGS), and general risk tolerance (GRT) on travel risk tolerance (TRT). This model is designed to assess the relative impact of these variables across the three countries (Serbia, Hungary, and Kazakhstan), highlighting cross-cultural differences in how individuals respond to travel-related risk information (Figure 1).
Figure 1: Structural framework of the analysis
*Note: PPR – Perceived physical risk; PFR – Perceived financial risk; PsyR – Perceived psychological risk; PSR – Perceived social risk; PTR – Perceived time risk; TTM – Trust in traditional media; TSM – Trust in social media; TGS – Trust in governmental sources; GRT – General risk tolerance; TRT – Travel risk tolerance
Source: Authors’ research
3. Methodology
3.1. Sample description and research design
This study compares domestic tourists in Serbia, Hungary, and Kazakhstan to explore differences in travel risk tolerance across diverse institutional settings. Serbia is characterized by widespread distrust in official institutions (Vučetić & Vukojević, 2025), Hungary by relatively higher institutional trust as an EU member (Kaposi & Gonda, 2025), and Kazakhstan by reliance on informal sources due to limited information freedom (Gulnur & Kamshat, 2025). Data were collected between July 2024 and December 2025, focusing exclusively on domestic tourism to capture culturally embedded perceptions of travel risk. Respondents were asked about their willingness to travel to destinations within their own country that may be perceived as risky due to health, safety, infrastructure, or social issues. However, areas under active conflict or war zones were excluded. Destinations were selected to reflect realistic insecurity scenarios (e.g., rural instability, infrastructure gaps, or socio-political tensions), which is particularly relevant in the post-pandemic context, where domestic tourism plays a key strategic role (Song et al., 2025). Tablet-Assisted Personal Interviewing (TAPI) was used to conduct face-to-face surveys, improving data quality by minimizing manual errors and enabling real-time validation (Song et al., 2025). Interviews were conducted by trained final-year tourism and social sciences students in public spaces. Informed consent was obtained, participation was anonymous, and ethical standards were strictly followed to ensure data integrity and minimize interviewer bias. A total of 1,332 valid responses were collected: 452 from Serbia (Belgrade, Novi Sad, Niš), 434 from Hungary (Budapest, Debrecen, Szeged), and 446 from Kazakhstan (Almaty, Astana, Shymkent). G*Power analysis (f² = 0.15, α = 0.05, 1 − β = 0.95, predictors = 9) estimated a required sample of 166 per country (Kang, 2021), confirming that the collected sample exceeds the threshold for statistical validity.
3.2. Instruments
The questionnaire was based on validated and theoretically grounded scales, measuring ten latent constructs: five dimensions of perceived risk, three dimensions of trust in information sources, and two dimensions of risk tolerance (general risk orientation and travel risk tolerance as the outcome variable). Responses were recorded on a seven-point Likert scale (1 = strongly disagree, 7 = strongly agree). Perceived risk was assessed using the Perceived Risk Scale in Tourism (Reisinger & Mavondo, 2005), covering physical, financial, psychological, social, and temporal risks, each operationalized through three items. Trust in information sources was measured by adapting the Media Trust and Risk Perception Scale (Siegrist et al., 2005), distinguishing trust in traditional media, social media, and government sources. General risk tolerance (GRT) was measured with the Risk Propensity Scale (Meertens & Lion, 2008), while travel risk tolerance (TRT) was assessed through the Travel Fear & Safety Attitudes Scale (Zheng et al., 2021). Detailed descriptions of all items are provided in Table 1.
Table 1: Combined scale of risk perception, trust in information sources, and risk tolerance
|
Factor |
Items |
|
Perceived physical risk (PPR) |
I believe that traveling to this destination could be physically dangerous. |
|
There is a high likelihood that I could get injured at this destination. |
|
|
I am concerned about the health conditions at this destination. |
|
|
Perceived financial risk (PFR) |
I worry that I could lose money if I travel to this destination. |
|
Unexpected expenses could arise during the trip. |
|
|
Traveling to this destination is not a good financial decision. |
|
|
Perceived psychological risk (PsyR) |
I would feel uncomfortable if I traveled to this destination. |
|
I am afraid of the unfamiliar culture or language. |
|
|
Just thinking about this trip makes me feel anxious. |
|
|
Perceived social risk (PSR) |
People I care about would not approve of my trip. |
|
My family members would worry about me traveling to this place. |
|
|
My friends might think I am being irresponsible if I go there. |
|
|
Perceived time risk (PTR) |
Traveling to this destination might be a waste of time. |
|
I could use that time for a more valuable experience. |
|
|
Delays and cancellations could ruin the entire experience. |
|
|
Trust in traditional media (TTM) |
I trust the information I get from TV and newspapers. |
|
Newspapers provide reliable travel safety information. |
|
|
TV news is a trustworthy source for travel warnings. |
|
|
Trust in social media (TSM) |
Information on social media about travel safety is reliable. |
|
Posts on social media influence my travel decisions. |
|
|
Blogs offer useful safety advice for travelers. |
|
|
Trust in governmental sources (TGS) |
I trust the travel advice issued by government institutions. |
|
Official government websites provide credible safety information. |
|
|
I follow official warnings about travel destinations. |
|
|
General risk tolerance (GRT) |
I enjoy taking risks in general. |
|
I often seek out new and risky experiences. |
|
|
I like trying things even if they involve risk. |
|
|
Travel risk tolerance (TRT) |
I am willing to travel even when there are potential safety risks. |
|
Travel warnings do not stop me from traveling. |
|
|
I frequently travel to places that others consider risky. |
Source: Authors’ research
A pilot study (n = 30 per country) was conducted in Serbia, Hungary, and Kazakhstan to assess linguistic clarity, time efficiency, and cultural relevance. Minor adjustments were made based on participant feedback, particularly for items on abstract risk dimensions. The instrument was then reviewed by three experts in safety, tourism, and consumer psychology, who confirmed its theoretical adequacy. Following their input, slight refinements were introduced to the introduction and terminology. The final version was validated through EFA and CFA, meeting all reliability and validity criteria, confirming its cross-cultural applicability.
3.3. Overview of analytical methods
Data analysis was conducted using IBM SPSS v26.0, AMOS v26.0, and SmartPLS 4, following a sequential approach. Descriptive statistics confirmed acceptable deviation from normality (skewness: − 0.812 to 0.636; kurtosis: − 1.278 to 0.991), with slight deviations detected by Shapiro – Wilk and Kolmogorov–Smirnov tests (p < 0.05). Given the large sample size, robust methods were applied as recommended by Kyriazos (2018). To ensure methodological rigor, both CFA (AMOS) and PLS-SEM (SmartPLS) were used. CFA validated the measurement model through model fit indices, while PLS-SEM enabled structural path estimation under partial non-normality, allowing for multiple predictors (Hair et al., 2020). This dual approach supports both construct validity and predictive robustness. Cross-country comparisons were made using independent samples t-tests on composite indices. Each national sample was tested separately for normality (Shapiro–Wilk, K-S tests) and variance homogeneity (Levene’s test), with assumptions met (p > 0.05). Cohen’s d ranged from 0.45 to 0.92, indicating moderate-to-large contextual differences in risk perception (Cohen, 1988). PLS-SEM confirmed reliability and validity: CR ranged from 0.818 to 0.910, AVE from 0.518 to 0.720, with all outer loadings > 0.708 and VIF < 3.3. Discriminant validity was supported via Fornell–Larcker and HTMT (< 0.85). Structural models explained substantial variance in travel risk tolerance (R²_RS = 0.594; R²_HU = 0.531; R²_KZ = 0.608), with Q² > 0.28 for all models, confirming predictive relevance. The strongest effects (f² up to 0.214) were linked to general risk tolerance (GRT) and trust in social media (TSM), especially in Serbia and Kazakhstan (Hair et al., 2020). Model fit and construct reliability followed psychometric standards: KMO > 0.80, CFI and TLI > 0.90, RMSEA < 0.06, and SRMR < 0.08 (Kyriazos, 2018). Effect sizes and predictive relevance were interpreted using Cohen’s and Hair et al.’s guidelines, confirming small-to-moderate but meaningful structural impacts. To validate cross-national comparisons, the MICOM procedure (Measurement Invariance of Composite Models) was conducted in SmartPLS 4, following the three-step approach by Henseler et al. (2016). Configural invariance was confirmed through identical model structure and indicator alignment across Serbia, Hungary, and Kazakhstan. Compositional invariance, tested via permutation (5,000 resamples), showed non-significant differences between original and permuted correlations (p > 0.05), confirming equivalence. In the third step, partial invariance was achieved, with equality of means and variances established for 8 out of 9 constructs. As full compositional invariance was satisfied, cross-country comparisons and MGA were deemed methodologically sound (Hair et al., 2020).
4. Results
The socio-demographic profiles of respondents from Serbia, Hungary, and Kazakhstan indicate several relevant differences. Gender distribution is relatively balanced, with the highest share of male respondents in Kazakhstan (47.1%) and the lowest in Serbia (44.7%). Kazakhstan has the most respondents aged 18–30 (38.6%), while Hungary leads in the 31–45 age group (41.7%). Serbia shows the most even age spread. Higher education is most common in Serbia (64.8%) and Hungary (65.4%), whereas Kazakhstan has the highest share with only secondary education (31.8%). Serbia reports the most employed respondents (66.6%), while Kazakhstan has the most students (21.5%). Unemployment rates are similar across countries. Income levels differ significantly: low-income respondents (<500 €) are most frequent in Kazakhstan (43.9%), while Hungary has the most high-income respondents (>1000 €) at 41.0%. Travel frequency is highest in Hungary (33.2% travel more than twice a year), whereas in Serbia and Hungary most respondents travel 1–2 times annually (48.9% and 49.3%, respectively), slightly more than in Kazakhstan (45.7%) (Table 2).
Table 2: Overview of respondents’ socio-demographic attributes
|
Characteristic |
Category |
Serbia (n = 452) |
Hungary (n = 434) |
Kazakhstan (n = 446) |
|
Gender |
Male |
202 (44.7%) |
198 (45.6%) |
210 (47.1%) |
|
Female |
250 (55.3%) |
236 (54.4%) |
236 (52.9%) |
|
|
Age |
18–30 years |
162 (35.8%) |
145 (33.4%) |
172 (38.6%) |
|
31–45 years |
178 (39.4%) |
181 (41.7%) |
168 (37.7%) |
|
|
46+ years |
112 (24.8%) |
108 (24.9%) |
106 (23.7%) |
|
|
Education |
Secondary |
128 (28.3%) |
116 (26.7%) |
142 (31.8%) |
|
Higher |
293 (64.8%) |
284 (65.4%) |
272 (61.0%) |
|
|
Postgraduate |
31 (6.9%) |
34 (7.9%) |
32 (7.2%) |
|
|
Employment |
Employed |
301 (66.6%) |
282 (65.0%) |
274 (61.4%) |
|
Unemployed |
68 (15.0%) |
64 (14.8%) |
76 (17.0%) |
|
|
Student |
83 (18.4%) |
88 (20.3%) |
96 (21.5%) |
|
|
Income |
<500 € |
102 (22.6%) |
74 (17.1%) |
196 (43.9%) |
|
500–1000 € |
246 (54.4%) |
182 (41.9%) |
162 (36.3%) |
|
|
>1000 € |
104 (23.0%) |
178 (41.0%) |
88 (19.7%) |
|
|
Travel frequency |
Less than once per year |
97 (21.5%) |
76 (17.5%) |
142 (31.8%) |
|
1–2 times per year |
221 (48.9%) |
214 (49.3%) |
204 (45.7%) |
|
|
More than 2 times per year |
134 (29.6%) |
144 (33.2%) |
100 (22.5%) |
Source: Authors’ research
4.1. Descriptive overview of survey items
Perceptions of risk dimensions differ notably across Serbia, Hungary, and Kazakhstan. Physical risk is most pronounced in Hungary and Kazakhstan, with Kazakhstani respondents especially concerned about health safety, while Serbian participants express comparatively lower concern. Financial risk is strongest in Kazakhstan, reflecting economic instability, while Serbians link it to broader macroeconomic issues; Hungarians perceive it as moderate but relevant. Psychological risk peaks in Hungary, where emotional discomfort is most apparent, followed by Kazakhstan; Serbian respondents report moderate levels, possibly due to greater familiarity with risky environments. Social risk is highest in Kazakhstan, likely due to collectivist cultural norms, while Serbian and Hungarian tourists show less sensitivity to social judgment. Temporal risk is most salient in Hungary (due to scheduling disruptions) and Kazakhstan (linked to delays), while Serbian respondents report lower concern, possibly due to lower expectations regarding infrastructure. Trust in information sources also varies. Hungarians express highest trust in traditional media and governmental sources, aligning with stronger institutions. Serbians and Kazakhstani respondents show less trust in these sources but rely more on social media, especially in Kazakhstan. General risk tolerance (GRT) is highest in Kazakhstan, reflecting adaptation to daily uncertainty, followed by Hungary and Serbia. Travel risk tolerance (TRT) is greatest among Hungarian tourists, moderate in Serbia, and more variable in Kazakhstan depending on the risk type. These differences highlight how cultural, informational, and institutional contexts shape tourists’ perceptions and behaviors under risk (Table 3).
Table 3: Summary statistics for individual measurement items
|
Item |
m_RS |
sd_RS |
λ_RS |
m_HU |
sd_HU |
λ_HU |
m_KZ |
sd_KZ |
λ_KZ |
|
PPR1 |
4.258 |
1.549 |
0.784 |
5.069 |
1.313 |
0.623 |
2.701 |
0.721 |
0.891 |
|
PPR2 |
2.746 |
0.919 |
0.565 |
2.678 |
1.655 |
0.711 |
4.067 |
1.260 |
0.592 |
|
PPR3 |
3.235 |
0.706 |
0.729 |
3.232 |
1.234 |
0.881 |
5.138 |
1.792 |
0.865 |
|
PFR1 |
3.472 |
1.597 |
0.635 |
4.455 |
1.592 |
0.889 |
3.834 |
0.823 |
0.573 |
|
PFR2 |
3.759 |
1.478 |
0.773 |
2.895 |
0.794 |
0.809 |
4.494 |
1.214 |
0.603 |
|
PFR3 |
4.682 |
0.985 |
0.881 |
4.460 |
1.285 |
0.730 |
3.473 |
0.857 |
0.852 |
|
PsyR1 |
3.580 |
1.441 |
0.573 |
2.762 |
1.221 |
0.731 |
4.228 |
0.834 |
0.834 |
|
PsyR2 |
3.949 |
1.552 |
0.715 |
5.482 |
0.995 |
0.584 |
3.285 |
1.815 |
0.719 |
|
PsyR3 |
4.044 |
1.570 |
0.832 |
5.541 |
1.734 |
0.881 |
3.321 |
1.443 |
0.621 |
|
PRS1 |
3.371 |
1.257 |
0.813 |
4.163 |
0.724 |
0.876 |
5.460 |
1.025 |
0.783 |
|
PRS2 |
3.699 |
1.344 |
0.802 |
2.866 |
1.018 |
0.868 |
3.107 |
1.648 |
0.771 |
|
PRS3 |
4.037 |
1.124 |
0.869 |
2.902 |
0.958 |
0.858 |
4.390 |
1.541 |
0.864 |
|
PTR1 |
3.007 |
1.610 |
0.581 |
4.880 |
1.307 |
0.660 |
3.345 |
1.183 |
0.882 |
|
PTR2 |
3.826 |
1.106 |
0.885 |
3.902 |
1.381 |
0.772 |
2.851 |
0.995 |
0.658 |
|
PTR3 |
4.623 |
1.689 |
0.728 |
3.221 |
1.440 |
0.867 |
5.317 |
1.240 |
0.657 |
|
TTM1 |
4.136 |
1.521 |
0.807 |
3.317 |
0.765 |
0.881 |
4.824 |
1.546 |
0.568 |
|
TTM2 |
3.453 |
1.120 |
0.867 |
4.176 |
1.797 |
0.726 |
2.792 |
0.872 |
0.859 |
|
TTM3 |
2.978 |
0.822 |
0.745 |
5.257 |
0.719 |
0.866 |
3.275 |
1.530 |
0.739 |
|
TSM1 |
3.215 |
1.782 |
0.634 |
4.186 |
0.736 |
0.847 |
3.161 |
1.419 |
0.867 |
|
TSM2 |
4.089 |
1.320 |
0.788 |
2.972 |
1.300 |
0.630 |
5.408 |
1.087 |
0.793 |
|
TSM3 |
3.545 |
1.011 |
0.869 |
2.660 |
1.819 |
0.727 |
4.913 |
1.263 |
0.870 |
|
TGS1 |
2.899 |
1.460 |
0.695 |
4.865 |
0.754 |
0.665 |
3.048 |
1.162 |
0.663 |
|
TGS2 |
3.685 |
0.726 |
0.578 |
3.846 |
1.085 |
0.790 |
4.709 |
1.486 |
0.825 |
|
TGS3 |
4.212 |
0.810 |
0.857 |
2.831 |
1.492 |
0.733 |
5.360 |
1.496 |
0.611 |
|
GRT1 |
3.127 |
1.178 |
0.641 |
3.230 |
1.226 |
0.776 |
4.447 |
1.157 |
0.780 |
|
GRT2 |
4.587 |
1.522 |
0.721 |
3.011 |
0.894 |
0.844 |
2.643 |
1.544 |
0.662 |
|
GRT3 |
3.294 |
1.679 |
0.678 |
4.496 |
1.778 |
0.862 |
3.840 |
0.947 |
0.714 |
|
TRT1 |
2.832 |
1.635 |
0.591 |
3.653 |
1.553 |
0.709 |
4.520 |
0.871 |
0.880 |
|
TRT2 |
4.485 |
1.204 |
0.887 |
3.119 |
1.424 |
0.841 |
3.308 |
1.208 |
0.603 |
|
TRT3 |
3.376 |
0.933 |
0.753 |
5.470 |
1.162 |
0.773 |
2.719 |
1.662 |
0.675 |
Note: * m – arithmetic mean, sd – standard deviation, α – Cronbach alpha, λ – factor loading
Source: Authors’ research
A split-sample approach was used to validate the factor structure: 60% of each national sample was analyzed via CFA and 40% via EFA (Serbia: n = 271/181; Hungary: n = 260/174; Kazakhstan: n = 267/179). The high KMO value (0.927) and significant Bartlett’s test (χ² = 8563.772; df = 378; p < 0.001) confirmed sampling adequacy (Kyriazos, 2018). The CFA supported a nine-factor model with 30 items, showing good fit across all countries (SRMR = 0.046; RMSEA = 0.042; CFI = 0.965; TLI = 0.951; GFI = 0.940; χ²/df = 2.182). All constructs demonstrated strong reliability (α and CR > 0.75), convergent validity (AVE > 0.50), and discriminant validity (Fornell–Larcker). Factor loadings were stable, with explained variance per factor between 45% and 62%, and cumulative variance over 90%. TRT exhibited robust psychometric properties, particularly in Kazakhstan and Hungary. Perceived risk dimensions were more pronounced in these two countries, while Serbia showed a more balanced profile. Trust in social media (TSM) proved especially reliable, and GRT and TRT consistently emerged as strong predictors of travel behavior under risk (Table 4).
Table 4: Measurement model evaluation: EFA and CFA
|
Factor |
Country |
m |
sd |
α |
E |
%V |
C% |
CR |
AVE |
|
PPR |
RS |
3.223 |
0.905 |
0.812 |
3.546 |
61.70 |
61.70 |
0.868 |
0.518 |
|
HU |
4.554 |
1.560 |
0.893 |
3.402 |
54.30 |
54.30 |
0.870 |
0.565 |
|
|
KZ |
4.511 |
0.830 |
0.741 |
3.519 |
56.10 |
56.10 |
0.776 |
0.719 |
|
|
PFR |
RS |
3.282 |
1.120 |
0.855 |
3.112 |
59.60 |
65.96 |
0.837 |
0.650 |
|
HU |
4.430 |
0.819 |
0.879 |
3.225 |
54.00 |
58.97 |
0.795 |
0.612 |
|
|
KZ |
3.884 |
1.218 |
0.734 |
3.366 |
55.50 |
60.98 |
0.899 |
0.511 |
|
|
PsyR |
RS |
3.139 |
1.239 |
0.799 |
3.091 |
58.80 |
70.22 |
0.842 |
0.557 |
|
HU |
4.070 |
1.369 |
0.872 |
2.893 |
53.90 |
63.64 |
0.893 |
0.546 |
|
|
KZ |
4.293 |
0.869 |
0.766 |
3.008 |
54.10 |
65.86 |
0.774 |
0.531 |
|
|
PRS |
RS |
4.570 |
1.472 |
0.782 |
2.678 |
56.00 |
74.48 |
0.839 |
0.714 |
|
HU |
3.815 |
0.775 |
0.888 |
2.778 |
52.90 |
68.31 |
0.784 |
0.516 |
|
|
KZ |
4.058 |
0.903 |
0.744 |
2.790 |
53.00 |
70.74 |
0.843 |
0.656 |
|
|
PTR |
RS |
4.724 |
0.899 |
0.785 |
2.523 |
55.40 |
78.74 |
0.827 |
0.572 |
|
HU |
3.137 |
0.705 |
0.857 |
2.306 |
52.20 |
72.98 |
0.859 |
0.601 |
|
|
KZ |
4.314 |
0.807 |
0.780 |
2.285 |
50.60 |
75.62 |
0.830 |
0.561 |
|
|
TTM |
RS |
4.436 |
0.939 |
0.890 |
2.268 |
53.40 |
83.00 |
0.831 |
0.628 |
|
HU |
3.867 |
1.330 |
0.837 |
2.186 |
50.90 |
77.65 |
0.823 |
0.532 |
|
|
KZ |
4.525 |
0.875 |
0.857 |
2.169 |
49.10 |
80.50 |
0.765 |
0.541 |
|
|
TSM |
RS |
4.697 |
1.004 |
0.736 |
1.788 |
52.70 |
87.26 |
0.851 |
0.613 |
|
HU |
4.888 |
1.272 |
0.886 |
1.894 |
49.40 |
82.32 |
0.768 |
0.595 |
|
|
KZ |
4.652 |
0.968 |
0.853 |
1.738 |
48.30 |
85.38 |
0.802 |
0.590 |
|
|
TGS |
RS |
4.100 |
1.345 |
0.864 |
1.565 |
50.30 |
91.52 |
0.818 |
0.553 |
|
HU |
3.995 |
1.367 |
0.878 |
1.611 |
48.10 |
86.99 |
0.761 |
0.539 |
|
|
KZ |
4.399 |
1.195 |
0.749 |
1.514 |
47.60 |
90.26 |
0.891 |
0.521 |
|
|
GRT |
RS |
3.955 |
1.492 |
0.845 |
1.272 |
48.00 |
95.78 |
0.775 |
0.580 |
|
HU |
4.615 |
1.663 |
0.741 |
1.284 |
46.60 |
91.66 |
0.852 |
0.604 |
|
|
KZ |
3.558 |
1.376 |
0.872 |
1.271 |
46.30 |
94.14 |
0.825 |
0.664 |
|
|
TRT |
RS |
3.863 |
0.807 |
0.877 |
1.093 |
45.80 |
98.20 |
0.803 |
0.616 |
|
HU |
4.589 |
0.913 |
0.853 |
1.170 |
45.20 |
96.00 |
0.823 |
0.638 |
|
|
KZ |
3.644 |
1.421 |
0.882 |
1.139 |
45.10 |
99.02 |
0.799 |
0.584 |
Note: * m – arithmetic mean, sd – standard deviation, α – cronbach alpha, CR – composite reliability, AVE – average variance extracted
Source: Authors’ research
The independent t-test results reveal significant differences in perceived risk and risk tolerance across the three countries. Serbian respondents generally report lower perceived risks and lower travel risk tolerance compared to Hungarians, who consistently demonstrate higher tolerance and trust. Kazakhstani participants display a mixed profile, with higher general risk tolerance but variable responses across specific risk dimensions. These findings reflect how institutional trust, cultural context, and personal attitudes shape travel-related risk perceptions and behaviors in distinct national settings (Table 5).
Table 5: Independent samples T-test results
|
Construct |
Comparison |
Mean Diff (m₁−m₂) |
t-value |
df |
p-value |
Sig. |
|
PPR |
Serbia vs Hungary |
-0.84 |
-5.862 |
884 |
0.000 |
*** |
|
Serbia vs Kazakhstan |
-0.79 |
-5.647 |
896 |
0.000 |
*** |
|
|
Hungary vs Kazakhstan |
0.05 |
0.762 |
878 |
0.447 |
n.s. |
|
|
PsyR |
Serbia vs Hungary |
-0.71 |
-4.215 |
880 |
0.000 |
*** |
|
Serbia vs Kazakhstan |
-0.89 |
-5.086 |
870 |
0.000 |
*** |
|
|
Hungary vs Kazakhstan |
0.18 |
2.019 |
890 |
0.044 |
* |
|
|
TRT |
Serbia vs Hungary |
-0.59 |
-4.899 |
881 |
0.000 |
*** |
|
Serbia vs Kazakhstan |
0.15 |
2.145 |
886 |
0.033 |
* |
|
|
Hungary vs Kazakhstan |
0.74 |
6.101 |
879 |
0.000 |
*** |
|
|
GRT |
Serbia vs Hungary |
-0.58 |
-4.498 |
882 |
0.000 |
*** |
|
Serbia vs Kazakhstan |
0.33 |
2.982 |
887 |
0.003 |
** |
|
|
Hungary vs Kazakhstan |
0.91 |
6.835 |
883 |
0.000 |
*** |
Note: * p < 0.05,** p < 0.01, *** p < 0.001, n.s. = not significant
Source: Authors’ research
The correlation matrix shows interconnections between risk dimensions, with contextual differences. In Kazakhstan, physical and financial risks are strongly linked (r = 0.877), reflecting generalized insecurity. Hungary shows weaker associations (r = 0.601), while Serbia lies in between (r = 0.836). Physical and psychological risks are closely connected in Serbia (r = 0.911) and Hungary (r = 0.844), but less so in Kazakhstan (r = 0.662), possibly due to adaptation to uncertainty. Financial and psychological risks show moderate correlations in all three countries, suggesting that economic concerns often trigger emotional responses (Table 6).
Table 6: Correlation Matrix (lower triangle)
|
Construct 1 |
Construct 2 |
Serbia |
Hungary |
Kazakhstan |
|
PFR |
PPR |
0.836 |
0.601 |
0.877 |
|
PsyR |
PPR |
0.911 |
0.844 |
0.662 |
|
PsyR |
PFR |
0.692 |
0.744 |
0.669 |
Source: Authors’ research
4.2. Structural equation modeling: SEM and MGA
Table 7 reveals notable cross-country differences in the factors shaping travel risk tolerance. In Serbia, travel decisions are primarily influenced by tangible risks—physical (β = 0.405), financial (β = 0.241), and temporal (β = 0.179), as well as strong individual risk orientation (β = 0.365) and trust in social media (β = 0.323). This indicates a predominantly pragmatic approach, where tourists weigh cost, timing, and safety more than emotional or institutional concerns. Hungarian tourists, in contrast, show a more balanced evaluation. Alongside physical and financial risks, psychological discomfort (β = 0.277) plays a significant role, suggesting heightened emotional awareness. Institutional trust is also more influential, trust in traditional media (β = 0.288) and government sources (β = 0.310) both significantly contribute to shaping travel confidence, reflecting a relatively stable information environment. In Kazakhstan, the strongest predictor is physical risk (β = 0.479), followed by social pressures (β = 0.241), trust in social media (β = 0.345), and personal risk orientation (β = 0.414). This suggests that decisions are driven by a combination of external insecurity and internal adaptability, while institutional sources remain largely irrelevant. The model underscores that while risk tolerance is a shared construct, its drivers are contextually embedded in each country’s cultural, informational, and socio-political environment.
Table 7: Structural model estimates and multigroup comparison by country
|
Path |
β |
t |
p |
Conclusion |
|
Serbia |
||||
|
PPR → TRT |
0.405 |
2.103 |
0.036 |
significant – physical risks are decisive for domestic tourists accustomed to uncertainty |
|
PFR → TRT |
0.241 |
3.558 |
0.000 |
significant – financial considerations clearly affect travel decisions |
|
PsyR → TRT |
0.215 |
1.457 |
0.146 |
not significant – personal discomfort does not outweigh rational factors |
|
PRS → TRT |
0.296 |
1.609 |
0.108 |
not significant – social judgment is not perceived as relevant when travel is normalized. |
|
PTR → TRT |
0.179 |
2.557 |
0.011 |
significant – time organization matters, especially for working individuals and families |
|
TTM → TRT |
0.150 |
1.700 |
0.090 |
not significant – traditional media are not perceived as highly objective |
|
TSM → TRT |
0.323 |
3.633 |
0.000 |
significant – social media shape attitudes, especially among youth |
|
TGS → TRT |
0.071 |
1.100 |
0.272 |
not significant – trust in government sources is limited |
|
GRT → TRT |
0.365 |
3.314 |
0.001 |
significant – individual risk orientation strongly impacts travel risk tolerance |
|
Hungary |
||||
|
PPR → TRT |
0.322 |
2.420 |
0.016 |
significant – physical safety is seriously considered |
|
PFR → TRT |
0.190 |
2.789 |
0.006 |
significant – cost concerns are present |
|
PsyR → TRT |
0.277 |
2.249 |
0.025 |
significant – psychological safety influences decisions, especially among families |
|
PRS → TRT |
0.081 |
1.234 |
0.218 |
not significant – social disapproval is negligible |
|
PTR → TRT |
0.109 |
1.398 |
0.163 |
not significant – travel logistics are usually planned efficiently |
|
TTM → TRT |
0.288 |
3.030 |
0.003 |
significant – traditional media remain highly respected |
|
TSM → TRT |
0.197 |
2.107 |
0.035 |
significant – younger travelers rely on social media for travel decisions |
|
TGS → TRT |
0.310 |
3.354 |
0.001 |
significant – trust in government sources is high (aligned with EU standards) |
|
GRT → TRT |
0.112 |
1.765 |
0.078 |
not significant – general risk orientation may not directly translate to travel-related behavior |
|
Kazakhstan |
||||
|
PPR → TRT |
0.479 |
3.751 |
0.000 |
significant – physical risks are crucial due to broader insecurity |
|
PFR → TRT |
0.082 |
1.172 |
0.242 |
not significant – economic instability de-emphasizes financial planning in tourism |
|
PsyR → TRT |
0.056 |
0.930 |
0.353 |
not significant – psychological barriers are overshadowed by tangible issues |
|
PRS → TRT |
0.241 |
2.185 |
0.029 |
significant – social norms and family influence travel acceptability |
|
PTR → TRT |
0.074 |
1.021 |
0.308 |
not significant – timing is secondary to security concerns |
|
TTM → TRT |
0.022 |
0.714 |
0.476 |
not significant – low trust in traditional media such as TV and newspapers |
|
TSM → TRT |
0.345 |
3.931 |
0.000 |
significant – social media are the primary information source |
|
TGS → TRT |
0.031 |
0.870 |
0.385 |
not significant – government institutions lack perceived credibility |
|
GRT → TRT |
0.414 |
3.492 |
0.001 |
significant – individual risk orientation outweighs institutional influence |
Source: Authors’ research
The MGA analysis confirms clear cross-country differences in what drives travel risk tolerance. Physical risk has a stronger impact in Kazakhstan than in Serbia (Δβ = – 0.074; p = 0.039), reflecting real security concerns. Hungarian tourists rely more on traditional media (Δβ = – 0.138; p = 0.016) and government sources (Δβ = – 0.239; p = 0.011), while Serbian travelers are more influenced by social media (Δβ = 0.126; p = 0.038) and personal risk orientation (Δβ = 0.253; p = 0.007). In Serbia and Kazakhstan, individual and digital factors dominate, while institutional trust plays a larger role in Hungary (Table 8).
Table 8: MGA-Based comparison of structural paths
|
Construct |
β_RS |
β_HU |
Δβ_RS-HU |
Δt_RS-HU |
Δp_RS-HU |
β_KZ |
Δβ_RS-KZ |
Δt_RS-KZ |
Δp_RS-KZ |
Q²_RS |
f²_RS |
Q²_KZ |
f²_KZ |
|
PPR |
0.405 |
0.322 |
0.083 |
1.534 |
0.129 |
0.479 |
-0.074 |
2.834 |
0.039** |
0.088 |
0.071 |
0.140 |
0.014 |
|
PFR |
0.241 |
0.190 |
0.051 |
2.058 |
0.020** |
0.082 |
0.159 |
4.136 |
0.112 |
0.118 |
0.053 |
0.018 |
0.033 |
|
PsyR |
0.215 |
0.277 |
-0.062 |
1.217 |
0.017** |
0.056 |
0.159 |
3.695 |
0.111 |
0.075 |
0.206 |
0.130 |
0.176 |
|
PRS |
0.296 |
0.081 |
0.215 |
2.610 |
0.118 |
0.241 |
0.055 |
1.430 |
0.095 |
0.064 |
0.064 |
0.277 |
0.211 |
|
PTR |
0.179 |
0.109 |
0.070 |
3.923 |
0.069 |
0.074 |
0.105 |
2.036 |
0.159 |
0.123 |
0.134 |
0.036 |
0.112 |
|
TTM |
0.150 |
0.288 |
-0.138 |
2.734 |
0.016** |
0.022 |
0.128 |
3.910 |
0.049** |
0.046 |
0.091 |
0.097 |
0.025 |
|
TSM |
0.323 |
0.197 |
0.126 |
2.872 |
0.038** |
0.345 |
-0.022 |
1.286 |
0.085 |
0.132 |
0.158 |
0.145 |
0.042 |
|
TGS |
0.071 |
0.310 |
-0.239 |
4.043 |
0.011** |
0.031 |
0.040 |
0.991 |
0.173 |
0.102 |
0.030 |
0.026 |
0.031 |
|
GRT |
0.365 |
0.112 |
0.253 |
4.298 |
0.007** |
0.414 |
-0.049 |
1.348 |
0.088 |
0.091 |
0.048 |
0.192 |
0.059 |
Source: Authors’ research
5. Discussion
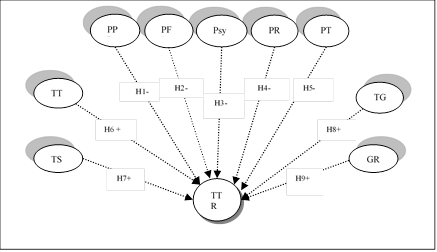
The findings confirm the multidimensional nature of travel risk tolerance and highlight significant cross-country differences among domestic tourists in Serbia, Hungary, and Kazakhstan, reinforcing prior claims about the contextual nature of tourist behavior under uncertainty (Li et al., 2024). In Serbia, despite strong correlations, physical risk was not a significant predictor, indicating adaptive resilience to institutional and infrastructural instability (Stevanović & Gajić, 2024). Conversely, in Hungary and Kazakhstan, physical risk significantly shaped decisions, reflecting their distinct security and infrastructure contexts (Tokodi, 2022). Financial risk was relevant in Serbia and Hungary but not in Kazakhstan, suggesting that rational cost considerations dominate in more stable environments, while emotional security takes precedence in less stable ones (Aliyeva et al., 2019). Psychological risk influenced only Hungarian tourists, potentially due to greater media exposure (Zhu & Deng, 2020), whereas its role was marginal in Serbia and Kazakhstan, where uncertainty appears normalized (Matiza & Kruger, 2021). Social risk was significant only in Kazakhstan, aligning with collectivist cultural norms (Najar & Rather, 2023). Temporal risk mattered in Serbia, likely due to infrastructural delays (Tanina et al., 2022). Trust in traditional media and government was more relevant in Hungary (Cheng et al., 2025), while social media influenced risk tolerance more in Serbia and Kazakhstan, consistent with lower institutional confidence (Martínez et al., 2020). General risk tolerance (GRT) was a consistent predictor across all countries, strongest in Kazakhstan, emphasizing personal disposition as a key factor in high-uncertainty settings. A grayscale heatmap (Figure 2) visualizes these differences, particularly in psychological risk and social media trust between Hungary and Kazakhstan, and physical risk between Serbia and Hungary.
Figure 2: Cross-national differences based on MGA p-values
Source: Authors’ research
The t-test results reveal significant cross-country differences in risk tolerance. Hungarian tourists exhibit the highest levels of both general and travel-related risk tolerance, likely driven by strong infrastructure, institutional trust, and travel familiarity. In contrast, Serbian tourists display moderate tolerance shaped by pragmatic decision-making, while Kazakhstani respondents show lower tolerance due to pronounced safety and health concerns. These patterns suggest that risk perceptions and information trust vary contextually, reflecting deeper cultural, institutional, and infrastructural factors. General risk orientation emerged as the most consistent predictor, underscoring its central role in shaping travel behavior across diverse national settings.
6. Concluding remarks
This study advances the understanding of travel risk tolerance by examining how perceived risks, information trust, and individual risk orientation interact across Serbia, Hungary, and Kazakhstan. The findings confirm that travel-related risk tolerance is not universal but context-dependent, shaped by cultural norms, institutional trust, and information channels. The integrated model, merging risk dimensions and trust in information, proved valid in predicting travel decisions under uncertainty. By offering a cross-country perspective, this research extends prior single-country studies and reinforces that general risk orientation and trust in digital sources exert differentiated effects (Godovykh et al., 2021; Warner-Søderholm et al., 2018). Theoretically, it affirms the value of combining psychological and informational factors to explain complex tourist behavior (Cheng et al., 2025; Yang & Wibowo, 2025).
Managerially, the results suggest that Serbia should address financial and time-related uncertainties through transparent digital tools, Hungary should strengthen institutional communication and emotional reassurance, and Kazakhstan must prioritize infrastructure and credible media. Across all contexts, individual risk orientation remains a consistent predictor (Blešić et al., 2024), highlighting the need for adaptable strategies based on diverse risk profiles.
Limitations include the timing of data collection (July–December 2024), which may reflect temporary post-crisis attitudes, and reliance on self-reported measures, which could introduce social desirability bias. The geographic scope also limits generalizability beyond Central and Eastern Europe. Future research should broaden the geographic sample and explore moderators such as digital literacy, political stability, and international relations. Mixed methods and longitudinal designs are encouraged to better capture emotional and cultural shifts in tourist risk perception.
CRediT author statement
Boriša Lečić: Writing – review & editing, Supervision. Yerlan Issakov: Software, Methodology, Formal analysis, Conceptualization. Lóránt Dénes Dávid: Writing – original draft, Visualization, Formal analysis, Conceptualization. Tamara Gajić: Writing – original draft, Validation, Investigation.
Declaration of generative AI in the writing process
During the preparation of this work the authors did not use generative AI and AI-assisted technologies in the writing process.
Acknowledgment
This research was supported by the Ministry of Science, Technological Development and Innovation of the Republic of Serbia (Contract No. 451-03-136/2025-03/200172).
Conflict of interest
The authors declare no conflict of interest.
References
1. Aliyeva, S., Chen, X., Yang, D., Samarkhanov, K., Mazbayev, O., Sekenuly, A., ... & Kozhokulov, S. (2019). The socioeconomic impact of tourism in East Kazakhstan Region: Assessment approach. Sustainability, 11(17), 4805. https://doi.org/10.3390/su11174805
2. Asaduzzaman, B. M., Sahiduja, S. M. J., Ara, R. G., & Arman, H. M. (2025). Exploring the influence of Facebook reels on consumer brand attitude and purchase intentions. Marketing, 56(1), 19–34. https://doi.org/10.5937/mkng2501019A
3. Blešić, I., Ivkov, M., Gajić, T., Petrović, M. D., Radovanović, M. M., Valjarević, A., ... & Lukić, T. (2024). Determinants influencing tourists’ willingness to visit Türkiye –Impact of earthquake hazards on Serbian visitors’ preferences. Open Geosciences, 16(1), 20220670. https://doi.org/10.1515/geo-2022-0670
4. Cheng, Z., Goyanes, M., & Gil de Zúñiga, H. (2025). Exploring the direct and indirect effects of traditional and social media news use on media trust and journalism error tolerance. Digital Journalism, 1–20. https://doi.org/10.1080/21670811.2025.2457362
5. Chernyshev, K. A., Alov, I. N., Li, Y., & Gajić, T. (2023). How real is migration’s contribution to the population change in major urban agglomerations? Journal of the Geographical Institute “Jovan Cvijić” SASA, 73(3), 371–378. https://doi.org/10.2298/IJGI2303371C
6. Chlachula, J., Zhensikbayeva, N. Z., Yegorina, A. V., Kabdrakhmanova, N. K., Czerniawska, J., & Kumarbekuly, S. (2021). Territorial assessment of the East Kazakhstan geo/ecotourism: Sustainable travel prospects in the southern Altai area. Geosciences, 11(4), 156. http://dx.doi.org/10.3390/geosciences11040156
7. Cohen, J. (1988). Statistical power analysis for the behavioral sciences (2nd ed.). Lawrence Erlbaum Associates. https://doi.org/10.4324/9780203771587
8. De La Hoz-Correa, A., & Muñoz-Leiva, F. (2019). The role of information sources and image on the intention to visit a medical tourism destination: A cross-cultural analysis. Journal of Travel & Tourism Marketing, 36(2), 204–219. http://dx.doi.org/10.1080/10548408.2018.1507865
9. Fuchs, K. (2024). Unravelling perceived travel risk: a regression study with implications for tourism planners. International Journal of Tourism Policy, 14(3), 257–271. https://doi.org/10.1504/IJTP.2024.138402
10. Godovykh, M., Pizam, A., & Bahja, F. (2021). Antecedents and outcomes of health risk perceptions in tourism, following the COVID-19 pandemic. Tourism Review, 76(4), 737–748. https://doi.org/10.1108/TR-06-2020-0257%20
11. Gulnur, R., & Kamshat, M. (2025). Defining a sustainable tourism perspectives in eastern part of Balkhash-Alakol Basin. Geo Journal of Tourism and Geosites, 58(1), 32–41. https://doi.org/10.30892/gtg.58103-1388
12. Hair, J. F., Hult, G. T. M., Ringle, C. M., & Sarstedt, M. (2020). A primer on Partial Least Squares Structural Equation Modeling (PLS-SEM) (3rd ed.). SAGE Publications.
13. Henseler, J., Ringle, C. M., & Sarstedt, M. (2016). Testing measurement invariance of composites using partial least squares. International Marketing Review, 33(3), 405–431. https://doi.org/10.1108/IMR-09-2014-0304
14. Hsiao, C. H., Chen, K. Y., Yeh, S. S., Hsieh, Y. T., & Huan, T. C. (2025). Does negative publicity change tourists’ advocacy intention on online hotel websites? Searching for answers from an online travel agency study. Service Science, 17(1), 58–70. https://doi.org/10.1287/serv.2023.0055
15. Kang, H. (2021). Sample size determination and power analysis using the G* Power software. Journal of Educational Evaluation for Health Professions, 18. https://doi.org/10.3352/jeehp.2021.18.17
16. Kaposi, Z., & Gonda, T. (2025). The beginnings of tourism development on Lake Balaton: The role of the Count Hunyady family in the development of Balaton tourism. Journal of Tourism History, 17(1), 71–89. https://doi.org/10.1080/1755182X.2024.2448956
17. Khasawneh, M. S., & Alfandi, A. M. (2019). Determining behaviour intentions from the overall destination image and risk perception. Tourism and Hospitality Management, 25(2), 355–375. https://doi.org/10.20867/thm.25.2.6
18. Kim, J., Park, J., Lee, J., Kim, S. (Sam), Gonzalez-Jimenez, H., Lee, J., ... & Marshall, R. (2021). COVID-19 and extremeness aversion: The role of safety seeking in travel decision making. Journal of Travel Research, 61(4), 837–854. https://doi.org/10.1177/00472875211008252
19. Kupi, M., & Bakó, F. (2024). Determining factors for tourist arrivals in Hungary. Journal of Infrastructure, Policy and Development, 8(8), 5862. http://dx.doi.org/10.24294/jipd.v8i8.5862
20. Kyriazos, T. A. (2018). Applied psychometrics: Sample size and sample power considerations in factor analysis (EFA, CFA) and SEM in general. Psychology, 9(08), 2207. http://dx.doi.org/10.4236/psych.2018.98126
21. Li, S., Xu, J., Jiang, Y., Walters, G., & Lehto, X. (2024). The impact of home environment insecurity on tourists’ self-protective behavior in the event of a terrorist attack. Journal of Travel Research, 00472875241288852. https://doi.org/10.1177/00472875241288852
22. Martínez, P., Herrero, Á., & García-de los Salmones, M. D. M. (2020). Determinants of eWOM on hospitality CSR issues. In Facebook we trust? Journal of Sustainable Tourism, 28(10), 1479–1497. http://dx.doi.org/10.1080/09669582.2020.1742133
23. Matiza, T., & Kruger, M. (2021). Ceding to their fears: A taxonomic analysis of the heterogeneity in COVID-19 associated perceived risk and intended travel behaviour. Tourism Recreation Research, 46(2), 158–174. https://doi.org/10.1080/02508281.2021.1889793
24. Meertens, R. M., & Lion, R. (2008). Measuring an individual’s tendency to take risks: The risk propensity scale. Journal of Applied Social Psychology, 38(6), 1506–1520. https://doi.org/10.1111/j.1559-1816.2008.00357.x
25. Najar, A. H., & Rather, A. H. (2023). Assessing the relationship of perceived risks with destination image and destination loyalty: A tourist's perspective visiting volatile destinations. Journal of Hospitality and Tourism Insights, 6(3), 1357–1379. https://doi.org/10.1108/JHTI-03-2022-0100
26. Nunkoo, R., & Gursoy, D. (2019). Political trust and residents’ support for alternative and mass tourism: An improved structural model. Tourism planning and development (pp. 12–33). Routledge. http://dx.doi.org/10.4324/9781315083742-2
27. Oshriyeh, O., Ghaffari, M., & Nematpour, M. (2022). Lines in the sand: The perceived risks of traveling to a destination and its influence on tourist information seeking behavior. International Journal of Tourism Cities, 8(4), 965–982. https://doi.org/10.1108/IJTC-07-2021-0138
28. Perić, G., Dramićanin, S., & Conić, M. (2021). The impact of Serbian tourists' risk perception on their travel intentions during the COVID-19 pandemic. European Journal of Tourism Research, 27, 2705–2705. http://dx.doi.org/10.54055/ejtr.v27i.2125
29. Pinto, H., Barboza, M., & Nogueira, C. (2025). Perceptions and behaviors concerning tourism degrowth and sustainable tourism: Latent dimensions and types of tourists. Sustainability, 17(2), 387. https://doi.org/10.3390/su17020387
30. Rahmafitria, F., Suryadi, K., Oktadiana, H., Putro, H. P. H., & Rosyidie, A. (2021). Applying knowledge, social concern and perceived risk in planned behavior theory for tourism in the Covid-19 pandemic. Tourism Review, 76(4), 809–828. https://doi.org/10.1108/TR-11-2020-0542
31. Rajnović, L., Borojević, N., & Eremić, J. (2025). Analysis of risk avoidance through diversification, with reference to agricultural farms. Economics of Agriculture, 72(2), 563–576. https://doi.org/10.59267/ekoPolj2502563R
32. Reisinger, Y., & Mavondo, F. (2005). Travel anxiety and intentions to travel internationally: Implications of travel risk perception. Journal of Travel Research, 43(3), 212–225. https://doi.org/10.1177/0047287504272017
33. Seočanac, M., & Veljović, I. (2025). Stress in paradise: Empirical evidence on emotional exhaustion of holiday representatives. Marketing, 56(2), 133–134. https://doi.org/10.5937/mkng2502133S
34. Siegrist, M., Gutscher, H., & Earle, T. C. (2005). Perception of risk: The influence of general trust, and general confidence. Journal of Risk Research, 8(2), 145–156. https://doi.org/10.1080/1366987032000105315
35. Silva Dos Santos, C., Lugosi, P., & Hawkins, R. (2025). Trust, traditions and indigenous women’s leadership in sustainable tourism management. Journal of Sustainable Tourism, 33(1), 46–62. https://doi.org/10.1080/09669582.2024.2309200
36. Song, H., Hsu, C. H. C., Pan, B., & Liu, Y. (2025). How COVID-19 has changed tourists’ behaviour. Nature Human Behaviour, 9(1), 43–52. https://doi.org/10.1038/s41562-024-02037-w
37. Stevanović, M., & Gajić, J. (2024). Post-pandemic travel intentions: The power of fears and changes in traveller behaviour. Teme, 48(1), 189–205. https://doi.org/10.22190/TEME230426010S
38. Tanina, A., Tashenova, L., Konyshev, Y., Mamrayeva, D., & Rodionov, D. (2022). The tourist and recreational potential of cross-border regions of Russia and Kazakhstan during the COVID-19 pandemic: Estimation of the current state and possible risks. Economies, 10(8), 201. https://doi.org/10.3390/economies10080201
39. Ting, W. A. N. G., Bi-hu, W. U., Fang, W. A. N. G., & Tao, X. U. E. (2020). The mechanism of effect of potential tourists' risk tolerance on travel intention under major epidemic situation – Based on the antecedent effect of place image in music video and the moderating effect of familiarity. Journal of Southwest University Natural Science Edition, 42(9), 1–13. https://doi.org/10.3390/su12135454
40. Tiwari, V., & Omar, A. (2023). The impact of the hotel star rating system on tourists’ health safety and risk perceptions: Study based on tourists’ vacation experiences. Journal of Vacation Marketing, 31(1), 157–173. https://doi.org/10.1177/13567667231188880
41. Tleuberdinova, A., Pratt, S., Kulik, X., Kulik, V., & Salauatova, D. (2025). The development of ecotourism in rural Kazakhstan: Residents’ perceptions of attractions and deterrents. Tourism Planning & Development, 1–21. https://doi.org/10.1080/21568316.2025.2481207
42. Tokodi, P. (2022). A Magyarországra érkező külföldiek turizmusbiztonsággal kapcsolatos percepciói [An evaluation of the security situation in tourism in Hungary from the perspective of foreign tourists]. Turizmus Bulletin, 22(2), 14–26. https://doi.org/10.14267/TURBULL.2022v22n2.2
43. Vasilić, M., & Savić, B. (2025). Accounting for agricultural activity: How transparent are Serbian companies? Economics of Agriculture, 72(2), 577–597. https://doi.org/10.59267/ekoPolj2502577V
44. Vučetić, V., & Vukojević, S. (2025). Media in Bosnia and Herzegovina: Between ethnic divisions and political pressures. Southeastern Europe, 48(2-3), 297–330. http://dx.doi.org/10.30965/18763332-48020006
45. Vukolić, D., Gajić, T., & Penić, M. (2022). The effect of social networks on the development of gastronomy – The way forward to the development of gastronomy tourism in Serbia. Journal of Tourism Futures, (ahead-of-print). https://doi.org/10.1108/JTF-01-2022-0034
46. Warner-Søderholm, G., Bertsch, A., Sawe, E., Lee, D., Wolfe, T., Meyer, J., ... & Fatilua, U. N. (2018). Who trusts social media? Computers in Human Behavior, 81, 303–315. https://doi.org/10.1016/j.chb.2017.12.026
47. Yang, R., & Wibowo, S. (2025). The effects of risk and uncertainty perceptions on tourists’ intention to visit former epicenters of COVID-19 post-pandemic: Evidence from China. Leisure Sciences, 47(1), 42–65. http://dx.doi.org/10.1080/01490400.2022.2061653
48. Zhang, M., Xu, P., & Ye, Y. (2022). Trust in social media brands and perceived media values: A survey study in China. Computers in Human Behavior, 127, 107024. https://doi.org/10.1016/j.chb.2021.107024
49. Zheng, D., Hung, K., & Lin, S. (2021). Traveler risk perception and avoidance behavior post-COVID-19. Tourism Recreation Research, 46(2), 258–262. http://dx.doi.org/10.54055/ejtr.v32i.2606
50. Zhu, H., & Deng, F. (2020). How to influence rural tourism intention by risk knowledge during COVID-19 containment in China: Mediating role of risk perception and attitude. International Journal of Environmental Research and Public Health, 17(10), 3514. https://doi.org/10.3390/ijerph17103514
51. Zou, Y., & Meng, F. (2020). Chinese tourists’ sense of safety: Perceptions of expected and experienced destination safety. Current Issues in Tourism, 23(15), 1886–1899. https://doi.org/10.1080/13683500.2019.1681382