 Original Scientific Paper
UDC: 005.6:338.488
338.484:502.131.1
DOI: 10.5937/menhottur2500011T
Milivoj Teodorović1, Danijel Pavlović2*, Jovan Popesku3
1 Independent Researcher, Belgrade, Serbia
2 Academy of Hospitality, Tourism and Wellness, Belgrade, Serbia
3 Centre for Responsible and Sustainable Tourism Development, Belgrade, Serbia
Abstract
Purpose – Previous research on sustainability, consumer value, and satisfaction of international tourists has revealed different outcomes and varying relationships. From the perspective of international tourists, the current study investigates the impact of the elements of sustainability on consumer value and satisfaction. Methodology – Based on the survey data from international tourists visiting Serbia, Partial Least Square (PLS) method determines relationship between sustainbility dimensions, consumer value and satisfaction. Findings – The results confirmed the validity, the dominant role of the economic and environmental elements, the robustness of the proposed models, and the existence of the sustainability – consumer value – satisfaction value chain. Implications – The findings contribute to the sustainability literature by highlighting previously overlooked fallouts demonstrating how the components of observed sustainability can be essential in perceived consumer value and satisfaction in an international tourist destination. The study offers a roadmap for further development and planning.
Keywords: destination sustainability, consumer value, satisfaction, international tourists, Partial Least Square (PLS)
JEL classification: Q01, L83, Z32
Uticaj elemenata održivosti na potrošačku vrednost i zadovoljstvo: Perspektiva stranih turista
Sažetak
Svrha – Prethodno istraživanje održivosti, potrošačke vrednosti i zadovoljstva dalo je različito tumačenje kad su u pitanju sastavni elementi i uzajamne povezanosti. Posmatrajući sa stanovišta međunarodnog turizma, ova studija analizira uticaj elemenata održivosti i potrošačke vrednosti kao i odnos između potrošačke vrednosti i zadovoljstva. Metodologija – Analizom podataka koji su dobijeni anketiranjem stranih turista u Srbiji, Partial Least Square (PLS) metodom utvrđuje se odnos između dimenzija održivosti, potrošačke vrednosti i zadovoljstva. Rezultati – Rezultati potvrđuju validnost, dominantnu ulogu ekonomskog i ekološkog faktora, robustan predloženi model i postojanje vrednosnog lanca: održivost – potrošačka vrednost – zadovoljstvo. Implikacije – Rad doprinosi literaturi o održivosti u turizmu u otkrivanju prethodno ignorisanih saznanja koja ukazuju na to kako dimenzije održivosti mogu biti ključne u objašnjenju percipirane potrošačke vrednosti i zadovoljstva u turističkoj destinaciji. Rad pruža smernice za dalji razvoj i planiranje.
Ključne reči: održivost destinacije, potrošačka vrednost, zadovoljstvo, inostrani turisti, Partial Least Square (PLS) metod
JEL klasifikacija: Q01, L83, Z32
The assessment of tourism sustainability (TS) (Cottrell et al., 2013; Iniesta-Bonillo et al., 2016; Kozic & Mikulic, 2014) has received a considerable attention from many authors in modern tourism research (Buckley, 2012; Higgins-Desbiolles, 2018; Tasci, 2018). However, not many studies attempted to validate TS on consumer value and satisfaction in the context of international tourism (Cottrell et al., 2013; Iniesta-Bonillo et al., 2016; Tasci, 2018). The significant reason for this was the lack of empirical data required for the analysis and the lack of empirical studies (Blancas et al., 2010; Ceron & Dubois, 2003). Furthermore, the lack of agreement on universally accepted set of indicators and their conceptualization (Butler, 1999) resulted in the selection of indicators established in the previous research.
The assessment of TS has always been tied to success in economic prosperity, social well-being, and environmental protection (Iniesta-Bonillo et al., 2016). Historically, however, supporting the concurrent growth of economic, social and environmental welfare and its impact on value for money and satisfaction proved to be a challenge for the tourism industry. Consequently, the tourism industry remained dauntingly unsustainable due to limited implementation (Higgins-Desbiolles, 2018). Reason is the abstract nature of TS requiring indirect approach through latent variables. The lack of the universal consensus on the definition of variables and their complexity, the scarcity of empirical literature on the topic, and the best possible conceptualization (Butler, 1999) increases the complexity of the research.
The destination brand context study was conducted in Belgrade, Serbia. Besides being most visited city in Serbia by foreign tourists and a major tourism hub Belgrade is estimated to have the potential of having the strongest general sustainable model, enhanced by consumer value and satisfaction to an extended sustainability model (ESM).
The models applied in the study consider only the perception of international tourists to better capture the particularities of the Serbian international tourism market. The data was collected individually using the Google Forms application by giving interviewers mobile phones with Google Forms application for self-entry. Only international tourists were interviewed between February and March 2021. Constructs satisfaction and value for money were borrowed from Aaker’s (1996) original measures. The study validates both general and extended sustainability models and the impact of the consumer value on satisfaction
The study fills the gap in research literature on how international tourists perceive relationships between the perceived individual elements of destination sustainability: economic, social, environmental, and consumer value and satisfaction. The study expands the tourism destination literature by widening methodological, theoretical, and practical horizons in evaluating international tourists’ perceptual merits. The paper enriches the research literature with a roadmap for assessing how international tourists perceive and impact destination’s sustainability, consumer value, and satisfaction. The paper offers a theoretical model for validating the critical relationships among sustainability components, proposed hypothesis, and the impact of consumer value on satisfaction.
2. Background
2.1. International tourist perception
International tourists’ experience is critical in understanding the impact of international tourists on destination sustainability. So far, the perceptual studies of international tourists have included destination image, products, attractions, attitude, behaviour, activities, coastal degradation, over-crowding, and qualitative studies (Prayag et al., 2020). However, the interest in how foreign tourists perceive tourist destinations is a recent phenomenon (Iniesta-Bonillo et al., 2016). Moreover, studies concerning international tourists perceptions of common sustainability elements and their relationship with consumer value and satisfaction are scarce (Iniesta-Bonillo et al., 2016; Prayag et al., 2020).
Higgins-Desbiolles (2018) argues that the term sustainable development is anthropogenic, as it relates to humans only, while ignoring the biodiversity and other species living on the planet. Many researchers advocate that the current tourism industry is not sustainable (Dwyer, 2017; Higgins-Desbiolles, 2018). The lack of agreement on measurement and conceptualization (Prayag et al., 2020) forces authors to adopt a multi-dimensional approach around economic, social, and environmental elements (Cottrell et al., 2013; Iniesta-Bonillo et al., 2016). Iniesta-Bonillo et al. (2016) proposed a paradigm to prove that tourists’ understanding of destination sustainability impacts tourists’ perceived satisfaction and the consumer value of the trip. Sánchez-Fernández et al. (2018) proposed a formulation of perceived sustainability as the tourists’ cognitive-affective evaluation of sustainability policies. Many researchers and international organizations base their sustainability models on the effects of sustainability on consumer value and satisfaction (Iniesta-Bonillo et al., 2016). However, none of the models both perceived tourist satisfaction and consumer value in the international context.
The study examines the relation between economic, social, and environmental constructs with consumer value and satisfaction, see Figure 1. The perceived economic dimension of sustainability refers to the cost of living, demand for public services, infrastructure, wages, indebtedness, and distribution of wealth to local communities. The perceived social dimension of sustainability relates to the conflict and competition for the local resources, services, recreational prospects, space, and facilities, the deterioration of local crafts and skills, the commodification of culture, and the degradation of traditional values, culture, and identity (Briassoulis, 2013; Dwyer, 2017).
Figure 1: Extended sustainability model
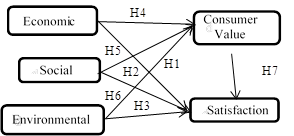 |
Source: Author’s research
Finally, the perceived environmental dimension of sustainability considers the adverse effects of growing tourism causing diminishing resources, the deterioration of landscape, the destruction of wildlife habitat, reducing wildlife and biodiversity, altering ecosystems, and increasing carbon footprint (Briassoulis, 2013).
2.3. Perceived satisfaction
Some authors view satisfaction as a cognitive-affective response to a judgment people experience, while the others think of pleasant or disappointed feelings from the outcome of the performance-expectation scenario (Moon et al., 2015). Tasci (2018) states that perceived tourism satisfaction commonly relates to the breadth to which tourists’ perceived presumptions are confronted or exceeded. Similarly, Oliver (1997, p. 13) views satisfaction as a completeness reply to the pleasurable or enjoyable experience in the context of over-or under-fulfillment. Tourists are satisfied when their experience with a destination evokes pleasurable and delightful feelings.
This study thus hypothesizes that the elements of sustainability perceived by international tourists influence tourist satisfaction:
H1: The perceived economic sustainability of international tourists positively impacts the perceived tourists’ satisfaction.
H2: The perceived social sustainability of international tourists positively impacts the perceived tourists’ satisfaction.
H3: The perceived environmental sustainability of international tourists positively impacts the perceived tourists’ satisfaction.
2.4. Perceived consumer value
According to Zeithaml (1988) consumer value is a swap between observed costs and benefits. In other words, consumers value a product (service) based on perceptions of what is given and what is received. Prior research shows that perceived price and quality are the significant predictors of perceived value (Duman & Mattila, 2005). In comparison, perceived value is a significant predictor of perceived satisfaction (Cronin et al., 2000; McDougall & Levesque, 2000) and behavioural intentions. Taski (2018) argues that perceived quality and price influence consumer value. Consumer value was one of the most frequently researched constructs in the previous century (Hirschman & Holbrook, 1982; Tasci, 2018; Thaler, 1985; Zeithaml, 1988). While consumer value’s relationship with customer-based brand equity is well researched (Aaker, 1996; Boo et al., 2009; Kim & Kim, 2004; Kim & Kim 2005; Konecnik & Gartner, 2007; Tasci, 2018; Yuwo et al., 2013; Zanfardini et al., 2011), interest in the association with the elements of sustainability has only gained momentum in the last decade (Choi & Ng, 2011; Closs et al., 2011; Iniesta-Bonillo et al., 2016). Similarly, Iniesta-Bonillo et al. (2016) and Pulido-Fernández and López-Sánchez (2014) suggest that a tourism destination’s perceived sustainability can predict how tourists perceive the value of a tourism destination based on overall experience. The authors argue that the perceptions of value for money and reasonable price, conceptualized as consumer value, respond positively to the sustainability elements, including those related to tourism destinations, see Figure 1. Accordingly, the study hypothesizes that:
H4: The perceived economic sustainability of international tourists positively impacts the perceived consumer value.
H5: The perceived social sustainability of international tourists positively impacts the perceived consumer value.
H6: Theperceived environmental sustainability of international tourists positively impacts the perceived consumer value.
2.5. Perceived consumer value and satisfaction
Several studies use consumer value as a standalone element to articulate that perceived price and quality influence satisfaction (McDougall & Levesque, 2000). The prior scientific literature confirms the impact of consumer’s value on satisfaction (Sanchez et al.,2006), see Figure 1, while expanding the results on destinations (Hutchinson et al., 2009; Lee et al., 2007). Accordingly, the study hypothesizes that consumer value influences destination satisfaction. Based on the stated conclusions, the study hypothesizes that:
H7: The perceived international tourist consumer value is a direct antecedent of perceived satisfaction.
3. Materials and methods
The partial-least square structural equation modelling (PLS-SEM) technique, using SmartPLS 4.0 software, that validates the extended sustainability model (H1-H7), see Figure 1, is more appropriate for exploratory research when there is little prior knowledge on data patterns and the smaller sample size (Hair et al., 2017).
3.1. Research instrument
The survey questions support prior literature on the international tourists’ perception of tourism destination sustainability, consumer value, and satisfaction (An & Suh, 2019; Boo et al., 2009; Chekalina Fuchs & Lexhagen, 2016; Iniesta-Bonillo et al., 2016; Konecnik & Gartner, 2007; Sánchez-Fernández et al., 2018; Taski, 2018). The questionnaire is amended and pre-tested to ensure data validity and consistency. A comprehensive review of the research literature produced twenty-five (25) observable variables affiliated with five (5) constructs (see Table 2): economic, social, environmental, consumer value, and satisfaction. The economic dimension uses a 5-item scale: consumer prosperity, local and tourist-oriented products, services, markets, and food, adapted from Sánchez-Fernández et al. (2018) and Iniesta-Bonillo et al. (2016). The social dimension uses a 7-item scale: heritage, conservation, friendliness, culture, host population, crowdedness, and safety, adapted from Chekalina et al. (2016) and Sánchez-Fernández et al. (2018). The environmental dimension uses an 8-item scale: ecological damage, smell, noise, environmentally friendly products, waste, environmental awareness, litter, and infrastructure, adapted from Buckley (2012), Iniesta-Bonillo et al. (2016) and Sánchez-Fernández et al. (2018). The consumer value uses a 2-item scale: value for money and reasonable prices, adapted from Chekalina et al. (2016) and Iniesta-Bonillo et al. (2016). Finally, the satisfaction uses a 3-item scale: the quality of services, experience, and superiority, adapted from Aaker (1996), Boo et al. (2009), Kao et al. (2012), Konecnik and Gartner (2007) and Pike (2010).
3.2. Sample design and data collection
A self-completed survey was designed and administrated using the Google Forms smartphone application. The survey gathered empirical statistics from international tourists visiting Belgrade, Serbia’s capital, between December 2019 and March 2020 in several locations around the city using face-to-face contacts and screening participants by country of origin. The Google Forms accepted only fully completed surveys, eliminating the missing data issues. The survey, which resulted in 161 voluntary responses, uses a 5-point Likert-type scale from (1) strongly disagree to (5) strongly agree. Based on five latent variables and 25 indicators, Westland’s (2010) software approved minimum 129 sample size for SEM analysis , with 0.10 effect size, 0.80 power level, and 0.05 significance level, confirming the adequacy of a sample size of 161 for the SEM analysis. The data is checked for the common method bias in SEM using Harmon’s one-factor test (Podsakoff & Organ, 1986). The SPSS analysis using the eigenvalue criteria produced a (5) factor solution explaining 69% of the variance. The first factor explained only 34% of the variance, confirming no common method bias issue. Also, the highest correlation of 0.589 in Table 4 is way below the threshold of 0.9, indicating no inter-correlation issue.
4. Results
4.1. Data features
The demographic analysis shows that out of 161 respondents 53% were females, 45.34% repeated visitors, and are between 20 and 40 years of age, see Table 1. The results show that Serbia is attractive to first-time visitors (54.66%), single (54.66%), entrepreneurs (39.13%), low-income (34.40%), married with children (21.12%), and those likely to travel with friends (35.40%) or partners (32.30%) (see Table 1).
Table 1: Demographics (n=161)
|
(n=161) |
|
(%) |
Freq. (#) |
Mean (1 to 5) |
|
Gender (n=161) |
Female |
53.42 |
86 |
3.59 |
|
|
Male |
46.58 |
75 |
3.54 |
|
First Time (n=161) |
Yes |
54.66 |
88 |
3.47 |
|
|
No |
45.34 |
73 |
3.68 |
|
Age (n=161) |
Under 20 |
5.59 |
9 |
3.46 |
|
|
20-29 |
40.99 |
66 |
3.60 |
|
|
30-39 |
36.02 |
58 |
3.59 |
|
|
40-49 |
13.66 |
22 |
3.41 |
|
|
50-59 |
3.73 |
6 |
3.61 |
|
Annual Income USD (n=161) |
Under $10K |
35.40 |
57 |
3.69 |
|
|
$10K-$20K |
22.98 |
37 |
3.60 |
|
|
$20K-$30K |
21.12 |
34 |
3.53 |
|
|
$30K-$40K |
8.07 |
13 |
3.28 |
|
|
Over $40K |
12.42 |
20 |
3.38 |
|
Occupation (n=161) |
Academic |
13.04 |
21 |
3.45 |
|
|
Student |
16.15 |
26 |
3.58 |
|
|
NGO |
2.48 |
4 |
2.96 |
|
|
Private |
39.13 |
63 |
3.53 |
|
|
Public |
18.01 |
29 |
3.70 |
|
|
Other |
11.18 |
18 |
3.73 |
|
Marital Status (n=161) |
Single |
54.66 |
88 |
3.59 |
|
|
Married w/c |
21.12 |
34 |
3.61 |
|
|
Married w/o |
11.18 |
18 |
3.49 |
|
|
Divorced |
3.73 |
6 |
3.52 |
|
|
Other |
9.32 |
15 |
3.43 |
|
Travel With(n=161) |
Friend |
35.40 |
57 |
3.51 |
|
|
Partner |
32.30 |
52 |
3.64 |
|
|
Relative |
8.07 |
13 |
3.57 |
|
|
Spouse |
7.45 |
12 |
3.37 |
|
|
Alone |
13.04 |
21 |
3.64 |
|
|
Other |
3.73 |
6 |
3.62 |
|
By Country(n=161) |
Montenegro |
8.70 |
14 |
4.08 |
|
|
Greece |
8.07 |
13 |
3.57 |
|
|
B&H |
8.07 |
13 |
3.79 |
|
|
Slovenia |
7.45 |
12 |
3.26 |
|
|
China |
7.45 |
12 |
3.46 |
Notes: w/c with children; w/o without children; B&H Bosnia and Herzegovina
Source: Authors’ research
Out of 28 countries in the survey, the top 5 countries account for 40% of the respondents, see Table 1. Montenegro is the most represented country in the survey (8.70%), followed by Greece (8.07%), Bosnia & Herzegovina (8.07%), Slovenia (7.45%), and China (7.45%). Traditionally, international tourists come from former Yugoslav republics, followed by Greece, Turkey, Russia, and more recently from China.
4.2. Measurement model
The internal consistency is validated using factor loadings and Composite Reliability (CR), while convergent validity is assessed through Average Variance Extracted (AVE) (Table 2). AVE’s square root, presented as diagonal values in Table 3, is higher than its corresponding correlation values (Fornell & Larcker, 1981), confirming discriminant validity. Recently, Fornell and Larcker’s (1981) discriminant validity method has caused some scrutiny among researchers who questioned its validity and reliability (Henseler et al., 2015). Consequently, Henseler’s et al. (2015) alternative method for evaluating discriminant validity based on the Heterotrait-Monotrait (HTMT) ratio of correlations which tests if the ratios of correlations exceed 0.85 (Kline, 2011). The results presented in Table 4 suggest that all correlations have values under 0.85, thus, confirming the discriminant validity.
Table 2: Validity and reliability
|
Latent Var |
Observable variables |
Loadings |
CR |
AVE |
|
Eco |
|
0.869 |
0.689 |
|
|
|
Compared to other countries visited, Serbia offers a variety of local products. |
0.812 |
|
|
|
|
Compared to other countries visited,, Serbia has more markets for local products. |
0.844 |
|
|
|
|
Compared to other countries visited,, Serbia offers various products and services for tourists to buy (souvenirs, food, drink, entertainment, coffee shops, street vendors, etc.). |
0.835 |
|
|
|
Soc |
|
|
0.846 |
0.734 |
|
|
Compared to other countries visited residents’ knowledge about their heritage (culture) is high. |
0.813 |
|
|
|
|
Compared to other countries visited, Serbia shows a strong sense of culture and traditions. |
0.899 |
|
|
|
Env |
|
0.888 |
0.799 |
|
|
|
Compared to other countries visited, the volume of solid waste in Serbian cities is acceptable. |
0.862 |
|
|
|
|
Compared to other countries visited, Serbia shows a high environmental awareness of residents. |
0.925 |
|
|
|
CV |
|
|
0.872 |
0.773 |
|
Compared to other countries visited, Serbia has reasonable prices. |
0.827 |
|
|
|
|
|
Compared to other countries visited,, Serbia offers a good value for money. |
0.929 |
|
|
|
Sat |
|
|
0.855 |
0.663 |
|
The quality of services in Serbian tourism is generally high. |
0.796 |
|
|
|
|
|
Serbia provides high-quality experiences. |
0.842 |
|
|
|
|
Serbia is superior as a tourist destination. |
0.803 |
|
|
Notes: L=Loadings; CR= Composite Reliability; AVE=Average Variance Extracted; Eco=Economy; Soc=Social; Soc=Social.; Env=Environmental; CV=Consumer Value; Sat=Satisfaction.
Source: Authors’ research
Table 3: Discriminant validity
|
Constructs |
1 |
2 |
3 |
4 |
5 |
|
Consumer Value |
0.878 |
|
|
|
|
|
Economic |
0.281 |
0.799 |
|
|
|
|
Environmental |
0.208 |
0.375 |
0.769 |
|
|
|
Satisfaction |
0.320 |
0.589 |
0.443 |
0.814 |
|
|
Social |
0.281 |
0.377 |
0.253 |
0.363 |
0.857 |
Notes: Off diagonal values are correlations, while diagonal values in bold are the square root of AV
Source: Authors’ research
Table 4: Heterotrait-Monotrait Ratio (HTMT)
|
Constructs |
Consumer Value |
Economic |
Environmental |
Satisfaction |
Social |
|
Consumer Value |
|
|
|
|
|
|
Economic |
0.339 |
|
|
|
|
|
Environmental |
0.238 |
0.490 |
|
|
|
|
Satisfaction |
0.401 |
0.733 |
0.490 |
|
|
|
Social |
0.397 |
0.451 |
0.293 |
0.515 |
|
Source: Authors’ research
4.3. Structural model
The PLS-SEM method was applied to analyse the hypothesized relationships H1-H7, see Figure, 3. The measurement model was first assessed to test validity and reliability, followed by the examination of the structural model (Hair et al., 2017). In the structural model assessment, the first step involved checking for multicollinearity. The results confirmed that this was not a concern, as all inner VIF values were below the recommended threshold of 3.
Bias‐corrected bootstrapping method with a 5000-maximum number of iterations shows a non-significant impact of the economic construct on consumer value (β = 0.159, t = 1.587, p= 0.113) and of the environmental construct on consumer value (β = 0.075, t = 0.829, p= 0.407), rejecting H4 and H6..There is a positive and significant impact of the social construct on consumer value (β = 0.216, t = 2.125, p < 0.05), confirming H5. Moreover, there is a positive and significant impact of the economic construct (β = 0.408, t = 6.106, p < 0.01), environmental construct (β = 0.170, t = 2.498, p < 0.05) and social construct (β = 0.163, t = 2.026, p < 0.05) on satisfaction confirming H1, H2 and H3. Finally, positive and significant impact of consumer value on satisfaction (β = 0.138, t = 1.969, p < 0.05), confirming H7. Furthermore, the economic, environmental and social constructs explain 11.5% of the variance in consumer value (R2 = 0.115) and 39.7% of the tourism satisfaction (R2 = 0.397), see Figure 3. According to Hair et al. (2011), the former can be considered weak, whereas the latter indicates a moderate explanatory power.
The model’s predicting power Q2 parameter is tested using the blindfolding procedure (Chin, 1998), where, for predictive relevance, the Q2 needs to be greater than zero. All endogenous variables, Hair et al. (2017) show satisfactory predictive power, see Figure 3. Cohen (1988) recommended scale for small (0.02), medium (0.15) and large (0.35) effects. The effect size range from small to medium, based on the predictive relevance f2 values shown in Table 5.
Figure 3: Causality model (H1-7)
![]()
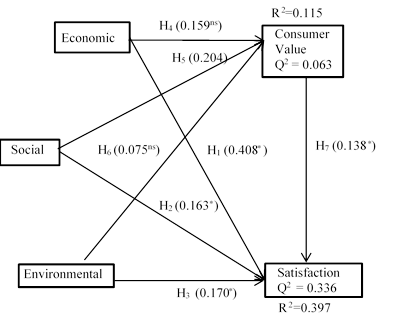
Table 5: Hypotheses testing results
|
Hypotheses |
Decision |
Beta |
T-value |
f-square |
|
H1: The perceived economic sustainability of tourists positively impacts perceived satisfaction. |
Confirmed |
0.408 |
6.106 |
0.213 |
|
H2: The perceived social sustainability of international tourists positively impacts perceived satisfaction. |
Confirmed |
0.163 |
2.026 |
0.037 |
|
H3: The perceived environmental sustainability of international tourists positively impacts perceived satisfaction. |
Confirmed |
0.170 |
2.498 |
0.041 |
|
H4: The perceived economic sustainability of international tourists positively impacts the perceived consumer value. |
Not Conf. |
0.159 |
1.587 |
0.023 |
|
H5: The perceived social sustainability of international tourists positively impacts the perceived consumer value. |
Confirmed |
0.216 |
2.125 |
0.047 |
|
H6: The perceived environmental sustainability of international tourists positively impacts the perceived consumer value. |
Not Conf. |
0.075 |
0.829 |
0.005 |
|
H7: The perceived international tourist consumer value is a direct antecedent of perceived satisfaction. |
Confirmed |
0.138 |
1.969 |
0.028 |
Source: Authors’ research
5. Discussion and implications
The study is concerned with relationships between the perceived elements of sustainability (economic, environmental, and social), and perceived consumer value and satisfaction, in the context of international tourist destination. Belgrade, the capital of Serbia, is selected because of the specific international tourism market dominated by tourists from former Yugoslav republics, now independent countries. The research validates that sustainability dimensions are related to perceived satisfaction and consumer value confirming previous research that supports the construct’s multidimensionality (Farsari, 2012). Moreover, the research suggests that companies that adopt sustainable development create value for consumers. Even though previous studies have linked perceived sustainability to perceived customer value, this is the first study that links the individual elements of perceived sustainability (economic, social, environmental) to perceived consumer value and satisfaction. The study validates six out of eight hypotheses, see Figure 3, and confirms the dominant role of the social element, as shown in Table 5.
6. Conclusion
The study confirms extended sustainability models. It expands theoretical horizons by confirming the positive impact of economy, environment, and consumer value on satisfaction. Furthermore, it provides a theoretical roadmap on how to significantly increase competitive superiority of a destination as it shows that the satisfaction of foreign tourists in Serbia mostly comes from economic awareness. The study shows that consumer value is influenced by social impact (culture, tradition, heritage, local products, etc.), rather than economic and environmental. Finally, consumer value influence satisfaction. Overall, the findings provide a roadmap for management in tourism organizations for strategic planning and resource utilization.
6.1. Limitations and future research suggestions
The analysis may be biased due to the interpretation of data as the study uses perceptual data from one tourist destination, both first-time and revisiting tourists. By collecting perceptual data on-site and not after the tourists return home, interpretation of the results could also lead to bias. Furthermore, data collected from foreign tourists in Belgrade may not fully reflect the broader perception of Serbia. Also, gender and age analysis may further highlight perceptual differences with implications on satisfaction and consumer value impacting the cross-validation of the model.
Future research on the subject should consider various components and markets by including semantically adapted questions with a more specific context. For example, rather than asking, “Serbia shows,” the formulation should change to “residents of Serbia show”. Finally, the study provides no information on the impact of demographics (e.g. gender, income, education, etc.) and travel characteristics (e.g., type of transport, period of the year, destinations visited, etc.). Expanding the sample frame scope to different and multiple tourism destinations, adding more variables, such as loyalty, behavioural intentions, image, and socio-cultural and institutional dimensions could improve the results. Finally, although meeting the criteria, it is always advisable to expand the sample size.
CRediT author statement
Milivoj Teodorović: Writing – original draft, Writing – review & editing, Visualization, Software, Methodology, Formal analysis, Conceptualization. Danijel Pavlović: Writing – review & editing, Validation, Supervision, Methodology, Investigation, Formal analysis, Conceptualization. Jovan Popesku: Writing – review & editing, Validation, Supervision, Methodology, Investigation, Formal analysis, Conceptualization.
Declaration of generative AI in the writing process
During the preparation of this work the authors did not use generative AI and AI-assisted technologies in the writing process.
Conflict of interest
The authors declare no conflict of interest.
References
1. Aaker, D. (1996). Building strong brands. New York: The Free Press.
2. An, S., & Suh, J. (2019). Examining structural relationships among service quality, perceived value, satisfaction and revisit intention for airbnb guests. International Journal of Tourism Sciences, 19(3), 145–165. https://doi.org/10.1080/15980634.2019.1663980
3. Blancas, F., González, M., Lozano-Oyola, M., & Perez, F. (2010). The assessment of sustainable tourism: Application to Spanish coastal destinations. Ecological Indicators, 10(2), 484–492. https://doi.org/10.1016/j.ecolind.2009.08.001
4. Boo, S. Y., Busser, J. A., & Baloglu, S. (2009). A model of customer-based brand equity and its application to multiple destinations. Tourism Management, 30(2), 219–231. https://doi.org/10.1016/j.tourman.2008.06.003
5. Briassoulis, H. (2013). Environmental impacts of tourism: A framework for analysis and evaluation. In Briassoulis & Van der Straaten (Eds.). Tourism and the environment: Regional, economic, cultural and policy (Vol. 6). (pp. 21–37). New York, NY: Springer Science & Business Media. https://doi.org/10.1007/978-94-015-9584-1
6. Brown, T. A. (2015). Confirmatory factor analysis for applied research. New York, London: The Guilford Press.
7. Buckley, R. (2012). Sustainable tourism: Research and reality. Annals of Tourism Research, 39(2), 528–546. https://doi.org/10.1016/j.annals.2012.02.003
8. Butler, R. W. (1999). Sustainable tourism: A state‐of‐the‐art review. Tourism Geographies, 1(1), 7–25. https://doi.org/10.1080/14616689908721291
9. Ceron, J.-P., & Dubois, G. (2003). Tourism and sustainable development indicators: The gap between theoretical demands and practical achievements. Current Issues in Tourism, 6(1), 54–75. https://doi.org/10.1080/13683500308667944
10. Chekalina, T., Fuchs, M., & Lexhagen, M. (2016). Customer-based destination brand equity modeling: The role of destination resources, value for money, and value in use. Journal of Travel Research, 57(1), 1–21. https://doi.org/10.1177/0047287516680774
11. Chin, W. W. (1998). The partial least squares approach to structural equation modeling. In G. A. Marcoulides (Ed.), Modern Methods for Business Research (pp. 295–358). Erlbaum.
12. Choi, S., & Ng, A. (2011). Environmental and economic dimensions of sustainability and price effects on consumer responses. Journal of Business Ethics, 104, 269–282. http://dx.doi.org/10.1007/s10551-011-0908-8
13. Closs, D. J., Speier, C., & Meacham, N. (2011). Sustainability to support end-to-end value chains: The role of supply chain management. Journal of the Academy of Marketing Science, 39, 101–116. http://dx.doi.org/10.1007/s11747-010-0207-4
14. Cohen, J. (1988). Statistical power analysis for the behavioral sciences (2nd ed.). Hillsdale, NJ: Lawrence Erlbaum Associates, Inc. https://doi.org/10.4324/9780203771587
15. Cottrell, S. P., Vaske, J. J., & Roemer, J. M. (2013). Resident satisfaction with sustainable tourism: The case of Frankenwald Nature Park, Germany. Tourism Management Perspectives, 8, 42–48. https://doi.org/10.1016/j.tmp.2013.05.005
16. Cronin, J. J., Brady, M. K., & Hult, G. T. (2000). Assessing the effects of quality, value and customer satisfaction on consumer behavioral intentions in service environments. Journal of Retailing, 76(2), 193–218. https://doi.org/10.1016/S0022-4359(00)00028-2
17. Duman, T., & Mattila, A. S. (2005). The role of affective factors on perceived cruise vacation value. Tourism Management, 26, 311–323. https://doi.org/10.1016/j.tourman.2003.11.014
18. Dwyer, L. (2017). Saluting while the ship sinks: The necessity for tourism paradigm change. Journal of Sustainable Tourism, 26(1), 29–48. https://doi.org/10.1080/09669582.2017.1308372
19. Farsari, I. (2012). The development of a conceptual model to support sustainable tourism policy in North Mediterranean destinations. Journal of Hospitality Marketing and Management, 21(7), 710–738. https://doi.org/10.1080/19368623.2012.624298
20. Fornell, C., & Larcker, D. F. (1981). Evaluating structural equation models with unobservable variables and measurement error. Journal of Marketing Research, 18(1), 39–50. https://doi.org/10.2307/3151312
21. Hair, J. F., Ringle, C. M., & Sarstedt, M. (2011). PLS-SEM: Indeed a silver bullet. Journal of Marketing Theory and Practice, 19(2), 139–152. https://doi.org/10.2753/mtp1069-6679190202
22. Hair, J. F., Hult, T. M., Ringle, C. M., & Sarstedt, M. (2017). A primer on partial least squares structural equation modeling (PLS-SEM). London: SAGE.
23. Henseler, J., Ringle, C. M., & Sarstedt, M. (2015). A new criterion for assessing discriminant validity in variance-based structural equation modeling. Journal of the Academy of Marketing Science, 43(1), 115–135. https://doi.org/10.1007/s11747-014-0403-8
24. Higgins-Desbiolles, F. (2018). Sustainable tourism: Sustaining tourism or something more? Tourism Management Perspectives, 25(1), 157–160. https://doi.org/10.1016/j.tmp.2017.11.017 .
25. Hirschman, E. C., & Holbrook, M. B. (1982). Hedonic Consumption: Emerging concepts, methods and propositions. Journal of Marketing, 46(3), 92–101. https://doi.org/10.1177/002224298204600314
26. Hutchinson, J., Lai, F., & Wang, Y. (2009). Understanding the relationships of quality, value, equity, satisfaction, and behavioral intentions among golf travelers. Tourism Management, 30, 298–308. https://doi.org/10.1016/j.tourman.2008.07.010
27. Iniesta-Bonillo, M. A., Sánchez-Fernández, R., & Jiménez-Castillo, D. (2016). Sustainability, value, and satisfaction: Model testing and cross-validation in tourist destinations. Journal of Business Research, 69(11), 5002–5007. https://doi.org/10.1016/j.jbusres.2016.04.071
28. Kao, Y. F., Huang, L. S., & Wu, C. H. (2012). Effects of theatrical elements on experiential quality and loyalty intentions for theme parks. Asia Pacific Journal of Tourism Research, 13(2), 163–174. https://doi.org/10.1080/10941660802048480
29. Kim, H., & Kim, W. G. (2005). The relationship between brand equity and firms' performance in luxury hotels and chain restaurants. Tourism Management, 26, 549–560. https://doi.org/10.1016/j.tourman.2004.03.010
30. Kim, W. G., & Kim, H. (2004). Measuring customer-based restaurant brand equity. Cornell Hotel and Restaurant Administration Quarterly, 45(2), 115–131. https://doi.org/10.1177/0010880404264507
31. Kline, R. B. (2011). Principles and practice of structural equation modeling (3rd ed.). Guilford Press.
32. Konecnik, M., & Gartner, W. C. (2007). Customer-based brand equity for a destination. Annals of Tourism Research, 34(2), 400–421. https://doi.org/10.1016/j.annals.2006.10.005
33. Kozic, I., & Mikulic, J. (2014). Measuring tourism sustainability: An empirical comparison of different weighting procedures used in modelling composite indicators. Zagreb. Tourism Economics, 20(2), 429–437. https://doi.org/10.5367/te.2013.0283
34. Lee, C. K., Yoon, Y. S., & Lee, S. K. (2007). Investigating the relationships among perceived value, satisfaction, and recommendations: The case of the Korean DMZ. DMZ. Tourism Management, 28, 204–214, https://doi.org/10.1016/j.tourman.2005.12.017
35. Martínez, P., & Rodríguez del Bosque, I. (2014). Sustainability dimensions: A source to enhance corporate reputation. Corporate Reputation Review, 17, 239–253. http://dx.doi.org/10.1057/crr.2014.13
36. McDougall, G. H., & Levesque, T. (2000). Customer satisfaction with services: Putting perceived value into the equation. Journal of Services Marketing, 14, 392–410. https://doi.org/10.1108/08876040010340937
37. Moon, H., Yoon, H. J., & Han, H. (2015). Role of airport physical environments in the satisfaction generation process: Mediating the impact of traveler emotion. Asia Pacific Journal of Tourism Research, 21(2), 193–211. https://doi.org/10.1080/10941665.2015.1048260
38. Oliver, R. L. (1997). Satisfaction: A behavioral perspective on the consumer. Singapore: McGraw-Hill.
39. Pavlović, D., Avlijaš, G., & Stanić, N. (2016). Tourist perception as key indicator of destination competitiveness. TEME, 40(2), 853–868.
40. Peloza, J., & Shang, J. (2011). How can corporate social responsibility activities create value for stakeholders? A systematic review. Journal of the Academy of Marketing Science, 39, 117–135. https://doi.org/10.1007/s11747-010-0213-6
41. Pike, S. (2010). Destination brand case study: Tracking brand equity for an emerging destination between 2003 and 2007. Journal of Hospitality & Tourism Research, 34(1), 124–139. https://doi.org/10.1177/1096348009349820
42. Podsakoff, P. M., & Organ, D. W. (1986). Self‐reports in organization research: Problems and prospects. Journal of Management, 12, 531–544. https://doi.org/10.1177/0149206312455245
43. Prayag, G., Hall, M., Fieger, P., & Chen, N. (2020). Understanding international visitors’ perceptions of sustainability of the Canterbury region from user generated content. CAUTHE 2020: Vision: New Perspectives on the Diversity of Hospitality, Tourism and Events (pp. 588–590). Auckland, New Zealand: Auckland University of Technology.
44. Pulido-Fernández, J. I., & López-Sánchez, Y. (2014). Perception of sustainability of a tourism destination: Analysis from tourist expectations. The International Business & Economics Research Journal, 13(7), 1587–1598. https://doi.org/10.19030/iber.v13i7.8908
45. Sanchez, J., Callarisa, L. J., Rodrıguez, R. M., & Moliner, M. A. (2006). Perceived value of the purchase of a tourism product. Tourism Management, 27(4), 394–409. https://doi.org/10.1016/j.tourman.2004.11.007
46. Sánchez-Fernández, R., Iniesta-Bonillo, M. Á., & Cervera-Taulet, A. (2018). Exploring the concept of perceived sustainability at tourist destinations: A market segmentation approach. Journal of Travel & Tourism Marketing, 36(2), 176–190. https://doi.org/10.1080/10548408.2018.1505579
47. Tasci, A. D. (2018). Testing the cross-brand and cross-market validity of a consumer-based brand equity (CBBE) model for destination brands. Tourism Management, 65, 143–159. https://doi.org/10.1016/j.tourman.2017.09.020
48. Thaler, R. (1985). Mental accounting and consumer choice. Marketing Science, 4(3), 199–214, https://doi.org/10.1287/mksc.4.3.199
49. Westland, J. C. (2010). Lower bounds on sample size in structural equation modeling. Electronic Commerce Research and Applications, 9(6), 476–487. https://doi.org/10.1016/j.elerap.2010.07.003
50. Yuwo, H., Ford, J. B., & Purwanegara, M. S. (2013). Customer-based brand equity for tourism destination (CBBETD): The specific case of Bundung City Indonesia. Organizations and Markets in Emerging Economies, 4-1(7), 8–22. http://dx.doi.org/10.15388/omee.2013.4.1.14255
51. Zanfardini, M., Tamagni, L., & Gutauskas, A. (2011). Customer-based brand equity for tourism destinations in Patagonia. Catalan Journal of Communication & Cultural Studies, 3(2), 253–271. https://doi.org/10.1386/cjcs.3.2.253_1
52. Zeithaml, V. (1988). Consumer perceptions of price, quality and value: A means-end model and synthesis of the evidence. Journal of Marketing, 52(3), 2–22. https://doi.org/10.1177/002224298805200302