| Original Scientific Paper | UDC: 338.48-44(23.0)(497.11) |
Bogdan Marković1, Milan Marković1, Dragana Velimirović1
1Academy of Applied Technical Studies – College of Traffic, Mechanical Engineering and Safety Engineering, Belgrade, Serbia
Abstract: Zlatar Ski Center has an extremely high potential as a ski resort that could be among the most visited ones in Serbia. What characterizes this center is the proximity of Kokin Brod Lake, the Tara River and the like. Therefore, Zlatar should be considered both as a ski center and in terms of other diversities. The aim of this paper is to analyze the possibility of expanding the capacity of ski resorts by increasing the possible flow of skiers on new ski lifts and ski slopes. The methods used in this paper belong to operational research, specifically, the geometric interpretation of linear programming. It is also shown how to optimize the extended capacities. If the capacities of ski slopes are to be increased, it would initiate greater investment in accommodation capacities in the area of the municipality of Nova Varoš, which would affect its improvement in terms of tourism.
Keywords: linear programming, ski lifts and ski slopes, optimization of extended capacity
JEL classification: C44, Z32
Primena linearnog programiranјa na dimenzioniranje proširenog kapaciteta ski centra Zlatar u Novoj Varoši
Sažetak: Ski centar Zlatar poseduje izuzetno visok potencijal kao skijalište koje bi moglo da bude u rangu najposećenijih u Srbiji. Ono što ovaj centar ističe, i u pozitivnom smislu izdvaja od drugih, je blizina jezera Кokin Brod, reke Tare i slično. Prema tome, Zlatar ne bi trebalo razmatrati samo kao ski centar, već i sa aspekta posedovanja i drugačijih diverziteta. Cilj rada je analiza mogućnosti proširenja kapaciteta skijališta povećanjem mogućeg protoka skijaša na žičarama i kapaciteta žičara. U tom smislu, predviđa se i povećanje broja staza, kao i interkonekcija između njih. Metode koje su korišćene u radu pripadaju operacionim istraživanjima, konkretno, geometrijska interpretacija linearnog programiranja. Prikazano je da je na ovaj način moguće optimizovati proširene kapacitete. Povećani kapacitet ski staza inicirao bi veće ulaganje u smeštajne kapacitete na prostoru opštine Nova Varoš, čime bi se uticalo na njeno unapređenje u turističkom smislu.
Кljučne reči: linearno programiranje, ski liftovi i ski staze, optimizacija proširenog kapaciteta
JEL klasifikacija: C44, Z32
1. Introduction
The paper provides an approach to establishing the required number of lifts in the case of expansion of Zlatar Ski Center assuming an increase in the number of ski slopes. The starting point is that the chair lift that supplies more ski slopes must not have a capacity greater than the capacity of the ski slope with the lowest capacity that gravitates to that lift. The reason is a security aspect (Wheeler, 2012). In the event that some of the ski slopes are closed and the capacity of the chair lift to which these ski slopes gravitate is fulfilled, skiers would be directed to one or more of the remaining ski slopes in service. In that case, the open ski slopes that are in service should not be overloaded. The flow of skiers should not be higher than the maximum availability of the ski slopes (Poulhès & Miria, 2017; Revilloud et al., 2011). For this reason, the sizing of the chair lifts is realized in the stated way. In the following chapters a model for sizing the capacity of lifts in accordance with the existing system of ski slopes and the projected capacity of new ones (Wheeler, 2012) will be provided.
The main hypothesis of this research is that it is possible to resize the capacity of Zlatar Ski Center, and based on mathematical model and linear programming implementation the optimal solution of extended model dimensioning of ski slopes and ski lifts could be calculated.
Optimization of tourist capacities with the necessary logistics is permanently present topic (Jangra & Kaushik, 2021), and the application of the linear programming for that purpose was considered in papers published before (Borrelli et al., 2003; Knijff & Oosterhaven, 1990).
2. Mathematical models for ski slopes capacity dimensioning
The capacity of a ski lifts system is projected by applying flow analysis and Kirchhoff's rule that total input to the system is equal to the output from it. It is necessary to respect the equation of flow continuity (Mađarević, 1969). The flow of skiers on the ski lifts is the function of the capacity of ski slopes by which the system is getting relieved. Chair ski lifts that lead to the peaks have the largest capacity. They are directed from the accommodation facilities, like hotel complex or ski bus terminus to the highest peaks. From these points, there is a flow divergence to smaller capacity T – bar type ski lifts, which cover the complex of ski slopes (Marković, 2019a; Suvajdžić, 1972). According to the fact that the organization of skiers’ flow is the main activity in the considered area (Zrnić, 1993), ski center represents a big system of internal transport.
2.1. Chair lift dimensioning
The capacity of ski lifts is dimensioned on the basis of the required flow of skiers, i.e. the available accommodation capacity of the hotel or the capacity of the bus line by which the skiers are brought to the starting point of the chair lifts. The capacity of the ski lifts leading from the starting point is the largest and matches the sum of capacities of smaller ski lifts (often T-bar type) which gravitate to the ski slopes capacity. According to that, the possibility of shifting skiers from one ski slope to the other has also to be considered. It is important that percentage of such flows must not exceed the maximum allowed ski slope capacity. Presentation of such a situation is provided for a hypothetical ski center in Table 1 and Figure 1 (Marković, 2019a).
Table 1 represents the schema for the share of skiers per hour crossing from one ski slope (rows) to the other (columns). Values in the cells are expressed in percentage of the maximum capacity of the ski slope, in skiers per hour that are expected to cross from one slope to another.
Table 1: Share of skiers per hour (%) crossings from one ski slope to another and ski slopes capacity of a hypothetic ski center
Ski slopes |
1 |
2 |
3 |
4 |
5 |
6 |
7 |
8 |
Capacity |
1® |
|
0 |
0 |
10 |
10 |
5 |
10 |
0 |
1000 |
2® |
5 |
|
0 |
0 |
0 |
5 |
5 |
5 |
2000 |
3® |
10 |
5 |
|
5 |
0 |
0 |
0 |
0 |
3000 |
4® |
5 |
10 |
0 |
|
0 |
0 |
5 |
10 |
1000 |
5® |
0 |
0 |
5 |
20 |
|
0 |
0 |
0 |
1000 |
6® |
0 |
0 |
5 |
0 |
5 |
|
5 |
5 |
500 |
7® |
5 |
0 |
5 |
10 |
0 |
5 |
|
0 |
2000 |
8® |
0 |
0 |
10 |
0 |
0 |
0 |
0 |
|
|
Source: Author’s research
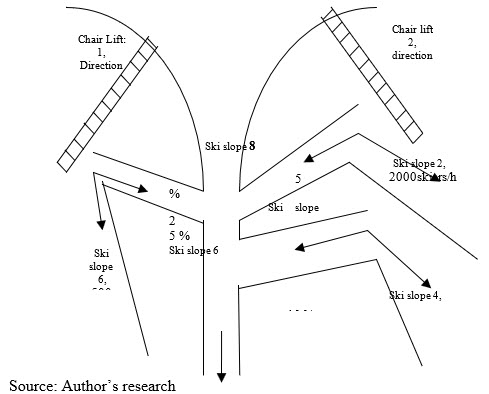
For example, the estimated share percentage of skiers crossing from the first ski slope to Slope 4, 5 and 7 is maximum 10%, while only 5% could be transferred to Slope 7. Accordingly, the capacity of each ski slope on which crossing is assumed has to be boosted according to enlarged number of skiers per hour. A similar approach is to be applied for other ski slopes (Marković, 2019a). In the case of designing a new ski slope, No. 8, which gravitates to the chair lift 2 from direction 1 and to the chair lift 1 from the same direction, including the inflow of skiers from other ski slopes, the layout will be as presented by scheme, Figure 1 (Marković, 2019a).
Figure 1: Ski slope 8 loading, by chair lifts and by adjacent ski slopes
Required capacity on the j of the total: n directions from the center of the ski resort, n = 3; I, II and III direction, to the peaks is as follows:
 ,
,
where:
-qji [skiers/h] – capacity of the i ski lift in the ј direction,
- m – total number of ski lifts in the ј direction.
The total flow of all ski lifts in skiers per hour is expressed by:
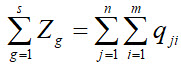 .
.
2.2. Ski slopes dimensioning
Necessary capacity tg of the ski slope g represents the projected hourly flow of skiers on that ski slope in the form:
 ,
,
where:
The capacity of all ski slopes is in the form:
 .
.
3. Design of necessary chairlifts and ski slopes capacity
Since the aim of this paper is analysis of possible capacity expansion of Zlatar Ski Center, it is necessary to present the current situation first. Zlatar Ski Center current state is represented in Figure 2 with ski slopes I and II, as well as the four-seat chairlift that leads from foot to the top, together with T–bar ski lift that leads from the fork point b1 to the peak point a1. Peak point a1 is top point to which it is possible to get from the foot of the mountain as well as from the middle fork point: b1, Figure 2. This paper estimates that in addition to the mentioned peak point and middle fork point b1, new peak points should be designed: a2 and a3, Figure 2. Skiers will be able to get to these points from the new base point S by newly designed chairlifts: 2, 3 and 4 as suggested in Figure 2. Skiers are expected to access several newly designed ski slopes, i.e. III to VI from top points a2 and a3, and from those new slopes middle points b2 to b5, Figure 2, skiers would be able to get to the top again by newly designed smaller capacity T-bar type ski lifts. According to that, skiers are not forced to descend to the base point in order to reach the top points again by high capacity ski lifts, but with smaller capacity, T–bar type ones. Considering the unused benefits of this ski center due to high snow amount and average number of snow days during the year, Table 2, this paper proposes a solution to the possible capacity expansion of this ski center by introducing new fork points, new ski slopes and ski lifts as described.
Тable 2: Average snowfall at Zlatar
Month |
Snow amount (week) |
Snow days (week) |
December |
16 cm |
2.8 days |
January |
20 cm |
3.3 days |
February |
22 cm |
3.5 days |
March |
23 cm |
3.4 days |
April |
10 cm |
1.6 days |
Source: Snow-forecast (2021)
According to the abovementioned, newly designed T–bar ski lifts would be used for taking skiers from mid-points bi, i = 2,… n, n =5 to points ai, i = 2, 3 on the peak as they will not be forced to take chairlift from the starting point S, Figure 2.
Altogether, the existing and newly designed layout of the Zlatar Ski Center is shown in Figure 2. The full lines show ski slopes, the dashed lines represent newly designed chairlifts in the directions toward a2 and a3 points. The Arabic numerals refer to chairlifts while Rome numerals refer to ski slopes.
Figure 2: Zlatar Ski Center, existing and newly designed layout
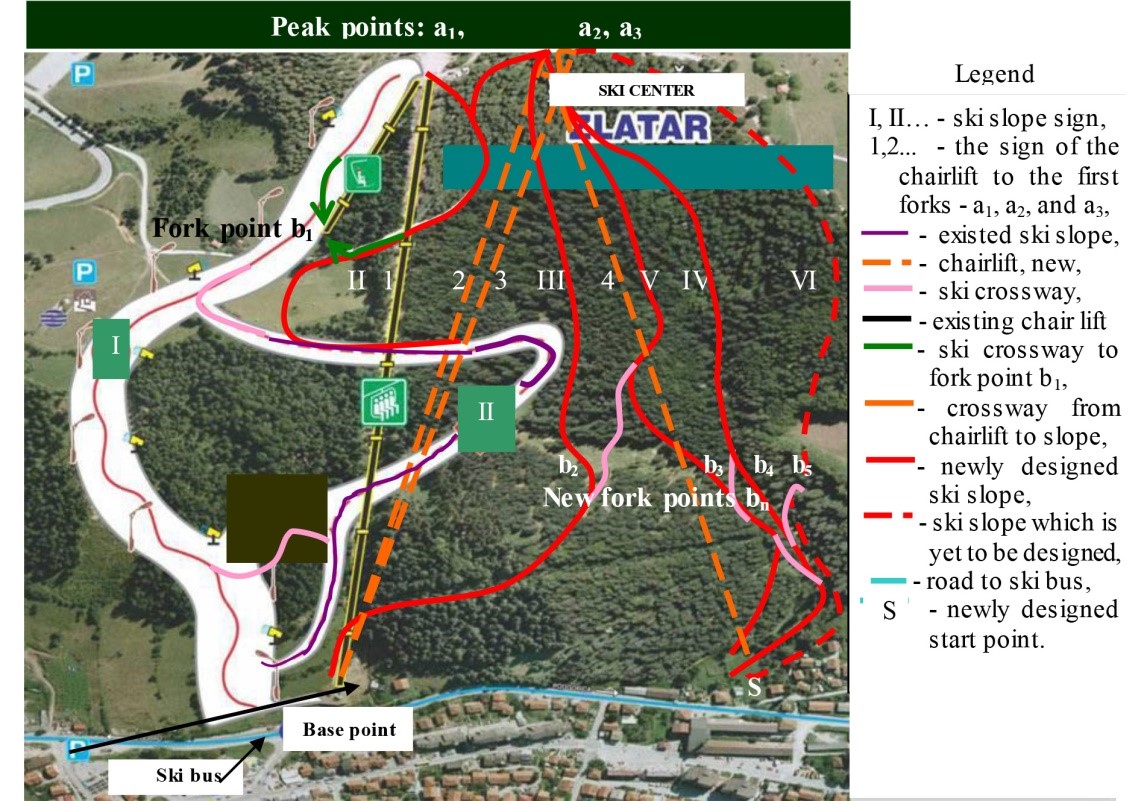
Source: ZlatarInfo Portal, Kornjacos, Tech (2021)
In order to increase the number of ski slopes and the chair lifts of Zlatar Ski Center, a new starting point is planned towards the fork points a2 and a3, as well as the crossing from one ski slope to another, Table 1 and Figure 2.
Newly designed concept introduces the expansion of the capacity of the Center, where it is necessary to harmonize the capacity of the newly designed ski slopes and the required capacity of the newly designed chair ski lifts, which leads to the optimization of the existing conditions. The required capacity of each of the four newly designed chair lifts that supply five ski slopes of the newly designed Ski center Zlatar is established. Ski center is to be designed with the ski slopes capacity of 1000, 2000, 3000, 2000 and 4000 skiers per hour.
The criterion for determining the required capacity of the ski lift is the fulfillment of the conditions that the capacity of the ski lift must be at maximum, but not higher than the capacity of the ski slope with the lowest through pass, comparing the through passes of all ski slopes that gravitate to that ski lift.
On the other hand, the capacities of chair lifts that supply a particular peak point “a”, Figure 2, must be approximately equal to the capacity of all smaller capacity T-bar ski lifts that gravitate to the point “a”. The capacity of chair lifts is in correlation to the capacity of the ski slopes that gravitate to them and is to be established in chapters that follow.
The required capacity of each of the newly designed chair lifts, including the existing one, is being established. The calculation is also realized in compliance with the principle that the total capacity of chair lifts that supply ski slopes must not be greater than the capacity of the lowest capacity ski slope from the aspect of the hourly flow of skiers. When performing the calculation (Marković, 2019a), the shifting of skiers from one ski slope to another is not foreseen while the chair lifts supply the ski slopes in the following way: ski lift No. 1 supplies the ski slopes 1 and 2; ski lift No. 2, supplies the ski slopes 2, 4, and 5; ski lift No. 3, supplies the ski slopes 3, 4 and 5; and ski lift No. 4, supplies the ski slope 5 as well as the newly designed one, i.e. No. 6, Figure 3.
Figure 3: Ski center scheme

Source: Author’s research
It is not allowed to achieve influx of skiers on the ski slope greater than its capacity. On the basis of this, through the geometric interpretation of linear programming (Nadler, 1973; Marković, 2019b; Borrelli et al., 2003; Kasana & Kumar, 2004), inequalities are formed for the maximum capacity (Nash & Sofer, 1996; Sarbjit, 2018) of each ski slope: i, i =1, ... , n=5, in the form:
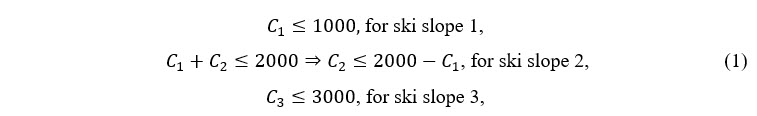

Inequalities follow in the next form:
In this case Ci, i = 1, ..., m, m = 4, represent the capacities of the ski lifts (Dedijer, 1983) that should weigh the highest possible value, whereby it is not possible to supply the ski slopes with the flow of skiers that exceed the capacity of the ski slope. It has to be noted that the requirement is that the capacity of the ski slope must not be exceeded even in the case of closing one of the ski slopes that are supplied by the same chair lift.
The objective function that represents the maximum flow of skiers on all ski slopes of the ski resort, and should strive for the maximum value is in the form:
Inequalities (1), (2), (3) and (4) are entered in diagram C1 – C2, Figure 4. A vertex coordinates of M1, M2, M3 and M4 represent capacities of chair lifts 1, 2, 3, and 4, Figure 4.
Figure 4: Chair lifts capacity domain and capacity of objective function (6)

Source: Author’s research
These vertexes form the closed polygonal line that bounds the domain for the chair lifts capacities in skiers per hour, i.e. С1, С2, С3, С4, (Marković, 2019a), and are as follows:

The largest traffic on the chair ski lifts is realized in the vertexes M3 and M4 (7). As it is not possible for traffic on the chair lift to be zero, by the reason of its abolition in that case, the values of coordinates in vertex M3 are to be adopted as adequate. That means that the capacity of the chair lifts will be С1=1000, С2=1000, С3=1000 and С4=2000 skiers per hour (7). This state is to be considered as optimal.
The coefficient of ski slope utilization from the aspect of cableway capacity is in the form:
Where: Si[skiers/h], i=1, ..., 5 − capacity of i - ski slope.
Authors of the paper created and ran the program SKIERS 6, based on Williams (2003), taking into account calculations presented in this chapter, (1) to (8). The results are presented in the chapter that follows. The difference is that in new cases the percentage of skiers crossing from one ski slope to the other is also included in account scheme. This option is described in the hypothetical example in chapter 2.
4. Results of the analysis of ski flows at Zlatar Ski Center, Nova Varoš
By applying the SKIERS 6 program package, the results listed in the files were obtained as follows:
Total capacity of all ski slopes: 12000 [skiers/h]
Total capacity of all chair ski lifts: 5000 [skiers/h]
The percentage utilization of the ski slopes is 41.66666 [%]
Minimum of the capacity necessary for the ski slope 1, calculated with no crossing to this ski slope from the others is 1000 [skiers/h]
Minimum of the capacity necessary for the ski slope 2, calculated with no crossing to this ski slope from the others is 2000 [skiers/h]
Minimum of the capacity necessary for the ski slope 3, calculated with no crossing to this ski slope from the others is 1000 [skiers/h]
Minimum of the capacity necessary for the ski slope 4, calculated with no crossing to this ski slope from the others is 2000 [skiers/h]
Minimum of the capacity necessary for the ski slope 5, calculated with no crossing to this ski slope from the others is 4000 [skiers/h]
Minimum of the capacity necessary for the ski slope 6, calculated with no crossing to this ski slope from the others is 2000 [skiers/h]
The scheme of the anticipated percentage of crossings from each ski slope to all the others [skiers/h] is as follows:
Ski slope No. 1 No. 2 No. 3 No. 4 No. 5 No. 6
Ski slope No. 1 0 200 0 0 0 0
Ski slope No. 2 0 0 0 0 0 0
Ski slope No. 3 0 0 0 0 0 0
Ski slope No. 4 0 0 0 0 200 0
Ski slope No. 5 0 0 800 400 0 0
Ski slope No. 6 0 0 0 400 0 0
Minimum of the capacity necessary for the ski slope 1 is: 1200 [skiers/h]
Efficiency coefficient of the ski slope No. 1 is: η(1)= 1.2
Minimum of the capacity necessary for the ski slope 2 is: 2000 [skiers /h]
Efficiency coefficient of the ski slope No. 2 is: η(2)= 1
Minimum of the capacity necessary for the ski slope 3 is: 1000 [skiers /h]
Efficiency coefficient of the ski slope No. 3 is: η(3)= 0.3333333
Minimum of the capacity necessary for the ski slope 4 is: 2200 [skiers /h]
Efficiency coefficient of the ski slope No. 4 is: η(4)= 1.1
Minimum of the capacity necessary for the ski slope 5 is: 5200 [skiers /h]
Efficiency coefficient of the ski slope No. 5 is: η(5)= 1.3
Minimum of the capacity necessary for the ski slope 6 is: 2400 [skiers /h]
Efficiency coefficient of the ski slope No. 6 is: η(6) = 1
Minimum of the capacity necessary for the all ski slopes is: 14000 [skiers /h]
Efficiency coefficient of all ski slopes from the aspect of the minimum necessary capacity is in the sum of 0.53.
It is stated that on the ski slopes 1 and 5, the utilization coefficient is higher than one due to the anticipated possibility of skiers crossing from one ski slope to another. This causes the necessary increase in the capacity of the ski slopes in order to reduce the utilization coefficients of the ski slopes 1 and 5. The improved solution is presented in the scheme of the ski resort, Figure 5.

Source: Author’s research
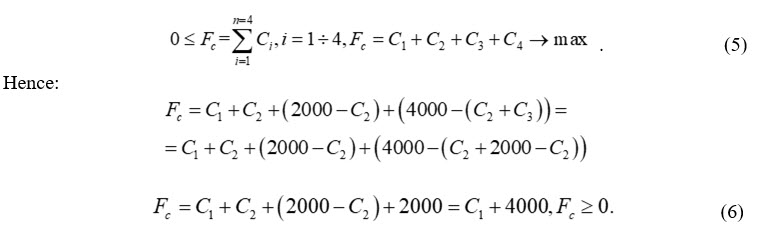
Based on Figure 5, through the geometric interpretation of linear programming, inequalities are formed for the maximum capacity of each ski slope: i, i =1, ... , n=6, in the form that follows:
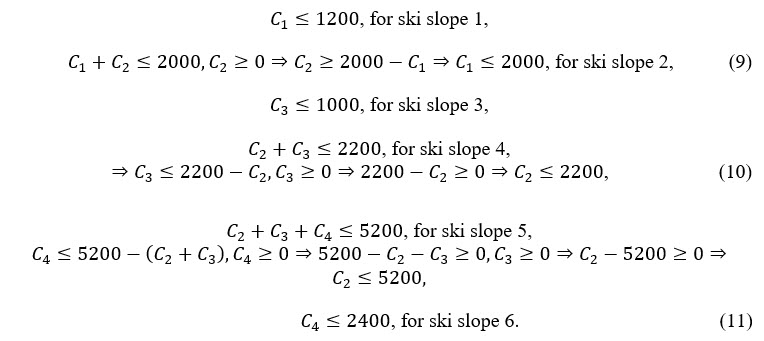
According to inequalities (9), (10) and (11), there follows:
Here, Сi, i=1, ..., m = 4, according to (12), represent the capacity of the chair lifts that should strive for the highest possible value, while it is not possible to supply the ski slopes with a flow of skiers that exceeds the capacity of them. It should be noticed that the capacity of the ski slope should not be exceeded even in the case of closing one of the ski slopes that is supplied by the same chair lift.
The objective function that represents the maximum flow of skiers on all ski slopes of the ski resort, and should strive for the maximum value, is in the form:

Figure 6: Chair ski lifts capacity domain

Source: Author’s research
Vertex coordinates М1, М2, М3, М4 of the domain, formed by closed polygonal line bounding the domain area that represents the chair lift capacities С1, С2, С3, С4 [skiers/h], (12), are as follows:

5. Discussion
According to previously mentioned in equation (14), the biggest flow on the chair lifts is assumed in vertex М3. That concerns the chair lifts capacities in the sizes: С1=1200, С2=800, С3=1000 and С4=2400 [skiers/h], (14). This state is considered to be the optimal one.
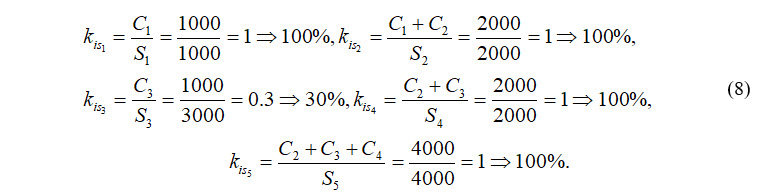
Efficiency coefficients of the ski slopes according to chair lift capacities are as follows in (16):

Where: Si [skiers/h], i=1, ..., 5 – capacity of i- ski slope.
6. Conclusion
This paper presents a mathematical model, geometric interpretation of linear programming, as well as the Standard Maximum Method and its usage in the field of transport. The aim of the paper is to analyze the possibility of expanding the potential of Zlatar Ski Center by designing new ski slopes as well as installing additional chair lifts in order to complete the tourist offer of that Center. Additionally, the paper also provides a model for finding the optimal capacity of additionally designed ski slopes. The ski center is studied as a large system of internal transport, considering that the analysis of the flow is the main activity.
The obtained results showed that it is possible to confirm the hypothesis stated at the beginning of this paper and get the optimal solution of the expanded capacity of the ski center by applying linear programming and the presented methodology.
This paper also presents the application of a software program, developed by the authors, to establish the coefficient of utilization of the ski slopes as well as the entire ski resort. The percentage of skiers who cross from one ski slope to another is also covered, together with “goal” function of the problem and detecting its maximum. Finding the maximum capacity of the projected system is also achieved.
Conflict of interest
The author(s) declare no conflict of interest.
References
Received: 24 June 2021; Sent for revision: 3 November 2021; Accepted: 30 November 2021